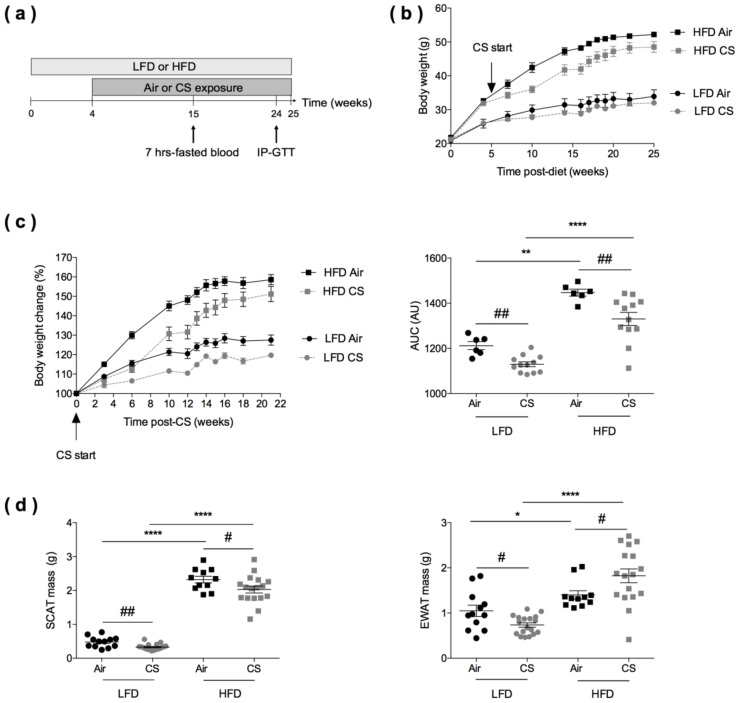
Figure 1.
Effects of chronic cigarette smoke (CS) exposure on the body weight and fat mass of lean (LFD) and obese (HFD) mice. (a) Experimental design of the study: the day of the start of the study was defined as day 0 allowing the association of this time point with the schedule of CS in lean and obese mice. Mice were fed with low-fat diet (LFD, lean) or high-fat diet (HFD, obese) for four weeks and exposed to ambient air (Air) or to cigarette smoke (CS) (5 cigarettes/day, 5 days/week) for additional 21 weeks. Intraperitoneal glucose tolerance (IP-GTT) was performed at week 24. (b) Body weight evolution (expressed in g) of lean and obese mice exposed to Air (n = 6) or CS (n = 12) from week 0 to week 25. Data are expressed as mean ± SEM. (c) Body weight change from CS start to 21 weeks post-CS exposure (expressed as % body weight loss from body weight at CS start) (left panel), and corresponding area under the curve (AUC) values (expressed in arbitrary units (AU) (right panel). Data are expressed as mean ± SEM. (d) Masses (expressed in g) of subcutaneous (inguinal) white adipose tissue (SCAT) (left panel) and epididymal white adipose tissue (EWAT) (right panel) were recorded at sacrifice, n = 11–12 in Air groups and n = 17–18 in CS groups. Data are expressed as individual and mean ± SEM values. * p < 0.05, ** p < 0.01, **** p < 0.0001, * correspond to diet effect (HFD vs. LFD), and # p < 0.05, ## p < 0.01, #correspond to CS effect (CS vs. Air).

