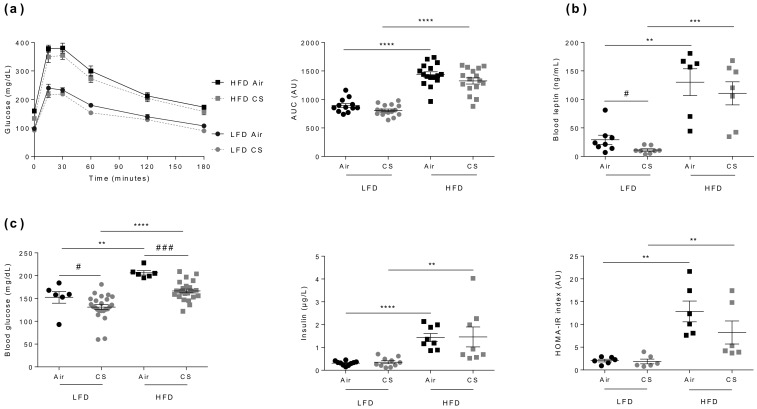
Figure 2.
Chronic cigarette smoke (CS) exposure has no impact on glucose homeostasis in lean (LFD) and obese (HFD) mice. (a) IP-GTT was performed at week-24. Blood glucose levels (expressed in mg/dL) were measured in overnight-fasted mice (0) and at the indicated times following glucose administration (left panel). The corresponding AUC values are shown (expressed in AU) (right panel), n = 12–16 per group. (b) Fasted (7 hours fasting) blood leptin levels (expressed in ng/mL) were quantified at week-15 (n = 6–8 mice per group). (c) Fasted (7 hours fasting) blood glucose (expressed in mg/dL) (left panel) and insulin (expressed in µg/L) (middle panel) levels were evaluated at week-15, and the homeostatic model for assessment of insulin resistance (HOMA-IR) was calculated (right panel), n = 6 mice per group. Data are expressed as individual and mean ± SEM. values. ** p < 0.01, *** p < 0.001, **** p < 0.0001, * correspond to diet effect (HFD vs. LFD), and # p < 0.05, ### p < 0.001, #correspond to CS effect (CS vs. Air).

