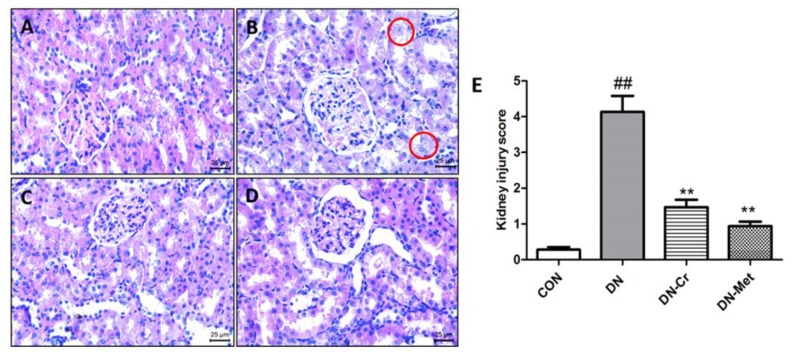
Figure 5.
Renal tissue structure and pathological score of renal lesions in each group. H&E staining; Magnification: 400×. (A) The kidney of a rat in the control group; (B) The kidney of a rat in the DN group; (C) The kidney of a rat in the DN- Cr group; (D) The kidney of a rat in the DN-Met group; (E) The pathological score of renal lesions in each group. Red circles are inflammatory cells; Compared to the control group, ## P < 0.01; Compared to the DN group, ** P < 0.01.

