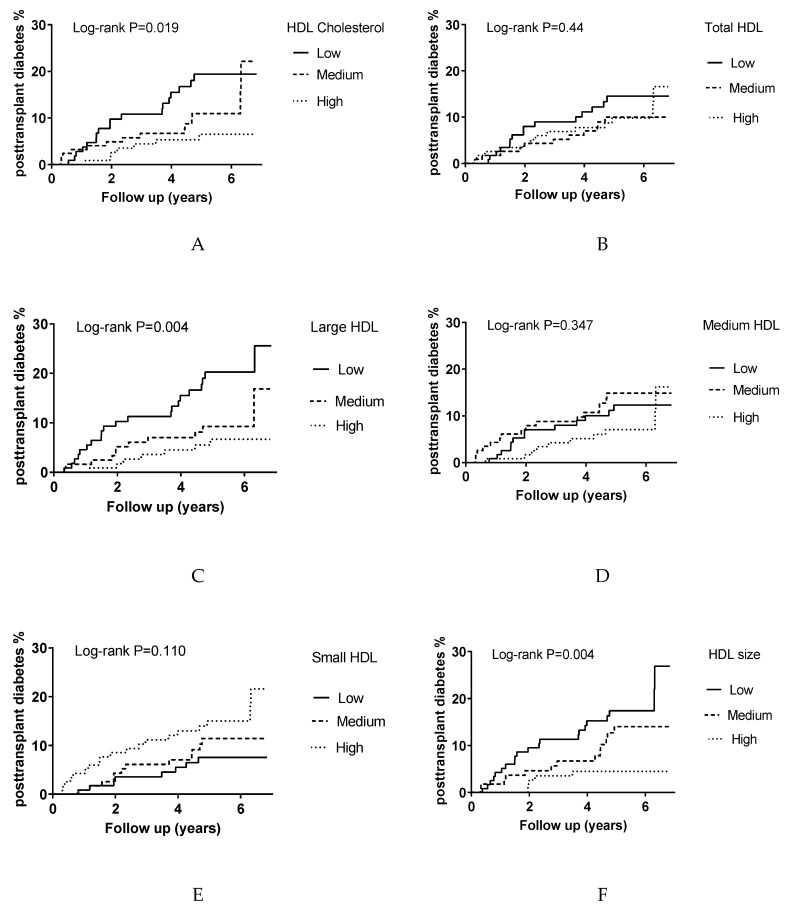
Figure 1.
Kaplan–Meier curves for PTDM development according to the tertiles of HDL indices in 351 RTRs. Panel (A) for HDL cholesterol, panel (B) total HDL particles, Panel (C) for large HDL particles, Panel (D) for for medium HDL particles, Panel (E) for small HDL particles, and panel (F) for HDL size.

