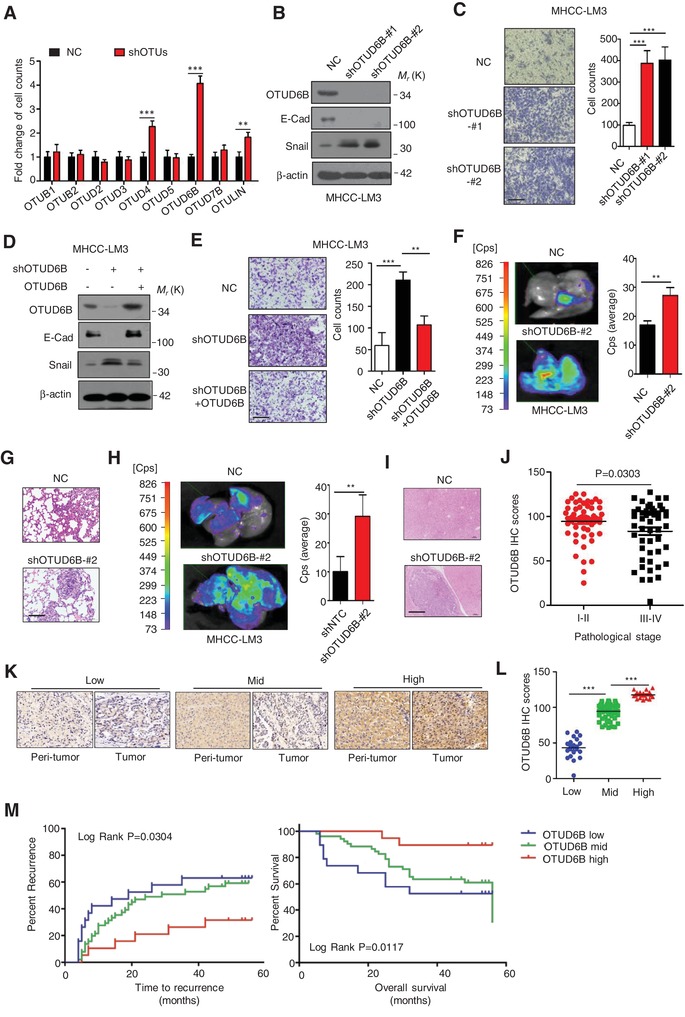
Figure 1.

OTUD6B suppresses HCC metastasis and its low level predicts poor survival in HCC patients. A) The lentivirus with shRNA targeting indicated OTU DUBs were each infected into MHCC‐LM3 cells and generated HCC cell lines with stable knockdown of indicated OTUs. Transwell assays were conducted. Results are shown as mean ± s.d. n = 3 independent experiments. ** P < 0.01, *** P < 0.001, Student's t test. B,D) Immunoblot assays were conducted with indicated antibodies in HCC cells (MHCC‐LM3) with OTUD6B stable knockdown. C,E) Transwell assay was conducted in HCC cells (MHCC‐LM3) with OTUD6B stable knockdown (scale bar, 50 µm). Results are shown as mean ± s.d. n = 3 independent experiments. ** P < 0.01, *** P < 0.001, Student's t test. F,H) 1×10⁶ Luciferase‐expressing HCC cells were injected into nude mice by tail vein. The mice were euthanized 8 weeks later by a cervical dislocation. F) Lung and H) liver tissues were isolated for analysis of IVIS imaging. Results are shown as mean ± s.d. n = 5 independent experiments. ** P < 0.01, Student's t test. Paraffin‐embedded sections of G) lung and I) liver tissues of nude mice were performed. Histology hematoxylin and eosin (H&E) staining was used to check formation of metastasis (scale bar, 100 µm). J) Immunohistochemistry (IHC) was performed with OTUD6B antibody on human HCC tissues. H‐score was calculated using the methods described in the Experimental Section. The scatter plot was used to show the OTUD6B IHC score of human HCC samples with pathological stage I–II or III–IV. K) Representative images from IHC staining of OTUD6B in HCC (scale bar, 100 µm). L) The scatter plot of OTUD6B IHC score in HCC samples with low, median and high OTUD6B level. *** P < 0.001, Student's t test. M) The Kaplan–Meier curves of OTUD6B in HCC for both overall survival (OS) and time to recurrence.
