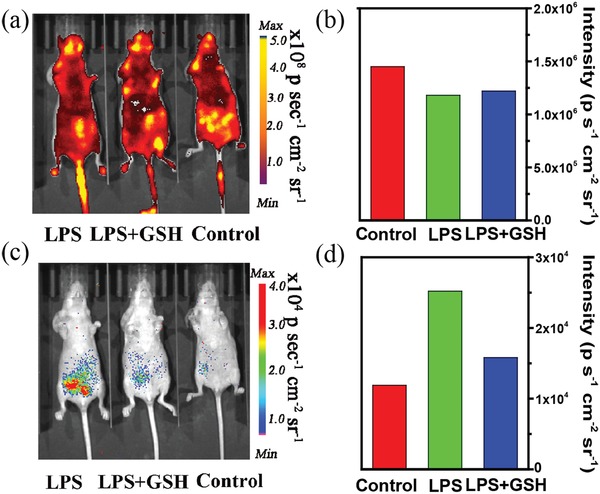
Figure 5.

In vivo imaging of endogenous H2O2 in the mouse model of peritonitis. a) Photoluminescence (PL) and c) chemiluminescent (CL) images of mice intraperitoneally treated with lipopolysaccharide (LPS), LPS plus glutathione (GSH) and saline, followed by an intraperitoneal injection of P‐CDs at t = 4 h later. Quantification of b) PL and d) CL intensities for the in vivo images.
