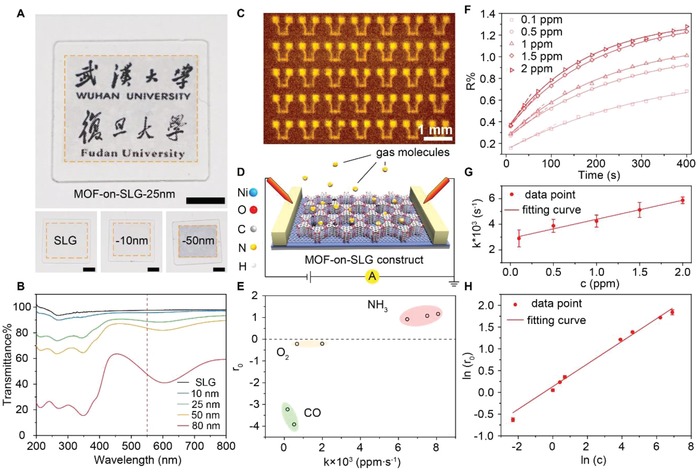
Figure 3.

Transparency and real‐time monitoring of gaseous environment. A) Optical images of Ni‐CAT‐1‐on‐SLG constructs and graphene on quartz. Scale bar is 500 mm. B) Transmission spectrum of Ni‐CAT‐1‐on‐SLG constructs and SLG. C) Infrared microscope image of Ni‐CAT‐1‐on‐SLG devices fabricated on silicon. Scale bar is 500 µm. D) Illustration of the device composed of Ni‐CAT‐1‐on‐SLG. E) Three kinds of gases, NH3, O2, and CO, differentiated by their response and k values. F) Time‐resolved adsorption curves of NH3 with different concentration detected by this device. The good fit between the experimental curve and the first‐order kinetic model indicate the accuracy of the gas detection. G) The kinetic coefficient (k) measured for each concentration of NH3 (c) based on the time‐resolved adsorption curve, revealing a linear relationship between k and c. H) The linear correlation between the electrical response given by the device upon NH3 adsorption and the concentration of NH3, which is typical for Freundlich isotherm.
