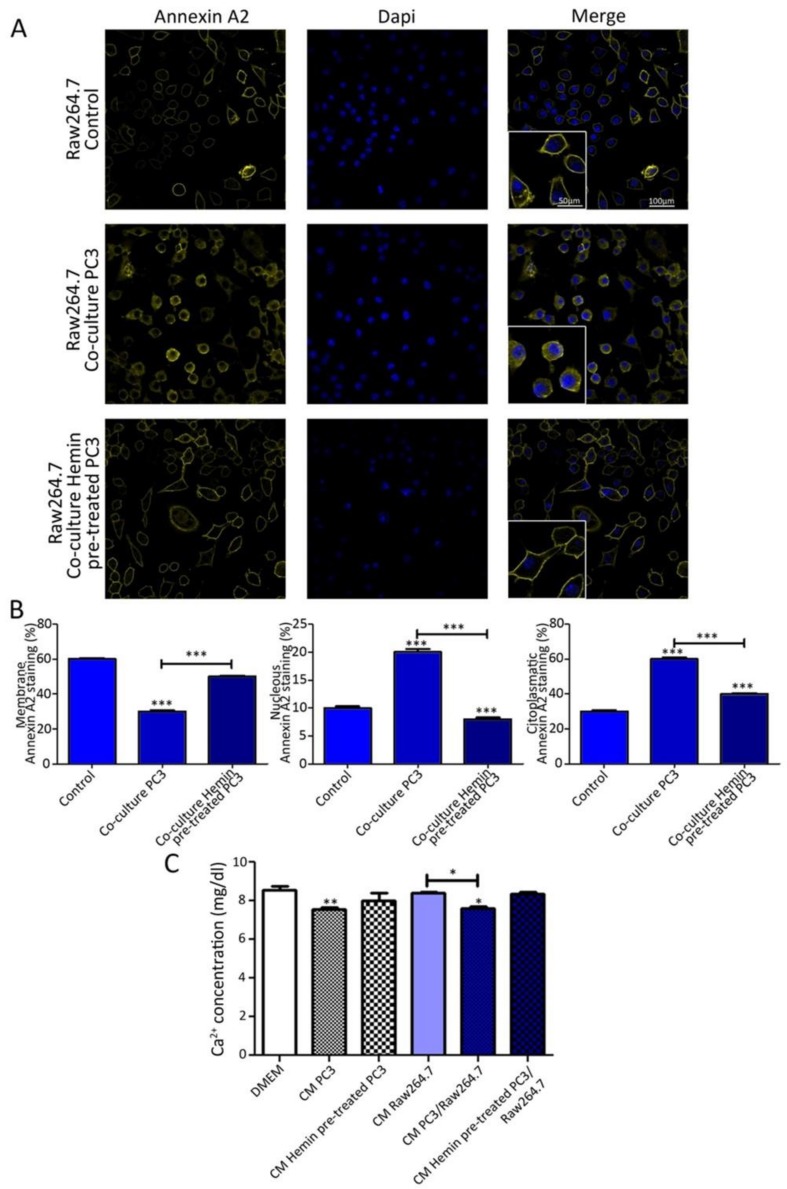
Figure 2.
ANXA2 subcellular localization in osteoclasts progenitors when co-cultured with tumor cells and under HO-1 induction. (A) Immunofluorescence (IF) staining and confocal microscopy analysis for ANXA2 on Raw264.7 grown alone or in co-culture with PC3 cells pre-treated or not with hemin (50 μM; 24 h). (B) Semi-quantitative analyses of the IF by segmentation of the whole cell, intracellular, and nucleus (DAPI). The florescence intensity for ANXA2 was calculated using ImageJ and normalized to cell size (n ≥ 180 cells for each condition). Percentage of staining in each compartment by cell-by-cell analysis is depicted. (C) Ca2+ concentration levels of conditioned media from PC3 and Raw264.7 cells growing in co-culture conditions. Statistical significance is shown with respect to the unconditioned DMEM medium. Bars depict comparisons among the other conditions. Significant differences: * p < 0.05, ** p < 0.01; *** p < 0.001.

