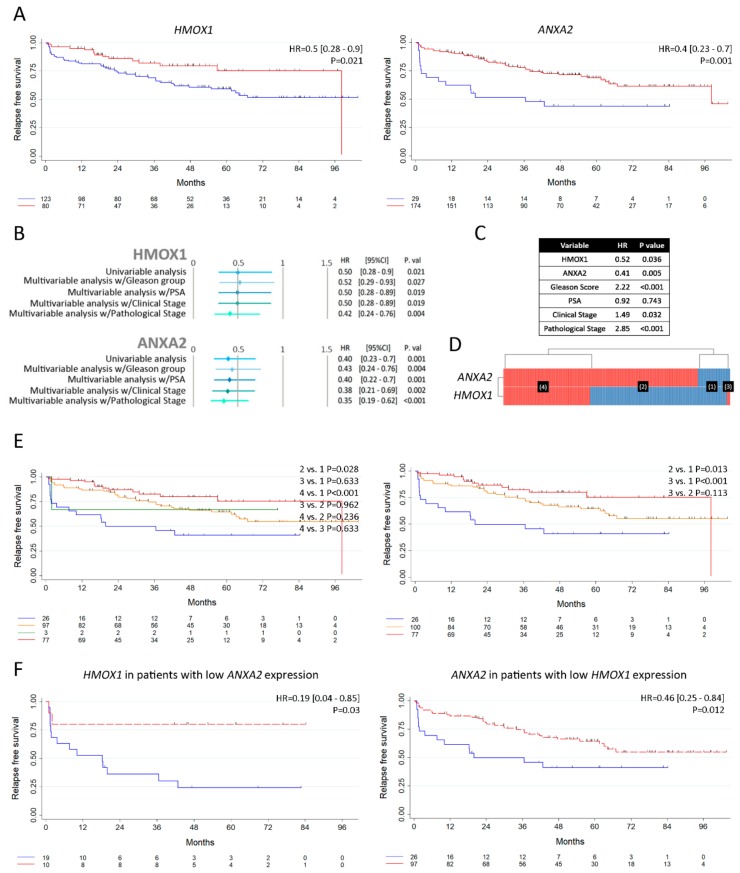
Figure 6.
Analysis of HMOX1 and ANXA2 as risk predictors of clinical outcome in PCa. (A) Kaplan–Meier (KM) curves for relapse free survival (RFS) (months) and risk table for PCa patients with high (red) or low (blue) expression of HMOX1 and ANXA2 in Ross-Adams dataset (n = 206). Low expression group was taken as a reference group. Logrank P, HR: Hazard ratio [95% confidence interval] and Cox P are specified. (B) Univariable and multivariable analyses are presented by forest plots for relapse free survival regarding HMOX1 (upper panel) or ANXA2 (lower panel) expression. Multivariable analysis w/Gleason group = adjusted for Gleason groups (6; 7 (3+4); 7 (4+3); 8-10). Multivariable analysis w/PSA = adjusted for PSA serum levels at diagnosis (PSA groups (ng/mL): < 4; 4-10; > 10). Multivariable analysis w/clinical stage = adjusted for patients’ clinical stage. Multivariable analysis w/pathological stage = adjusted for patients’ pathological stage. w/= with. (C) Multivariable analyses based on the mRNA expression of HMOX, ANXA2, Gleason Score, PSA at time of diagnosis, clinical and pathological stage for patients with PCa in the Ross-Adams dataset. (D) Heatmap depicting low (blue) or high (red) HMOX1 and ANXA2 mRNA expression for patients with PCa according to the Ross-Adams dataset. Patient subgroups are presented in black boxes. (E) RFS of patients with low HMOX1 and ANXA2 expression (n = 26) (1), high ANXA2 and low HMOX1 expression (n = 97) (2), low ANXA2 and high HMOX1 expression (n = 3) (3), and high ANXA2 and HMOX1 expression (n = 78) (4) (left panel); RFS of patients with low HMOX1 and ANXA2 expression (n = 26) (1), either high ANXA2 or HMOX1 expression (n = 100) (2), and high ANXA2 and HMOX1 expression (n = 78) (3) (right panel). (F) KM curves for RFS and risk table for PCa patients with high (red) or low (blue) expression of HMOX1, segregated based on low ANXA2 (left panel); and high (red) or low (blue) expression of ANXA2, segregated based on low HMOX1 (right panel). Stata software (StataCorp LLC, Texas, USA) was used to assess the patient’s overall and RFS and to generate Kaplan–Meier curves. Minimal p-value approach from the Cutoff Finder tool [31] was used to stratify patients in two groups based on the gene expression levels. For univariable and multivariable analyses of prognostic factors, Log-rank test and Cox proportional hazard model regression was employed. Statistical significance was set at p < 0.05.

