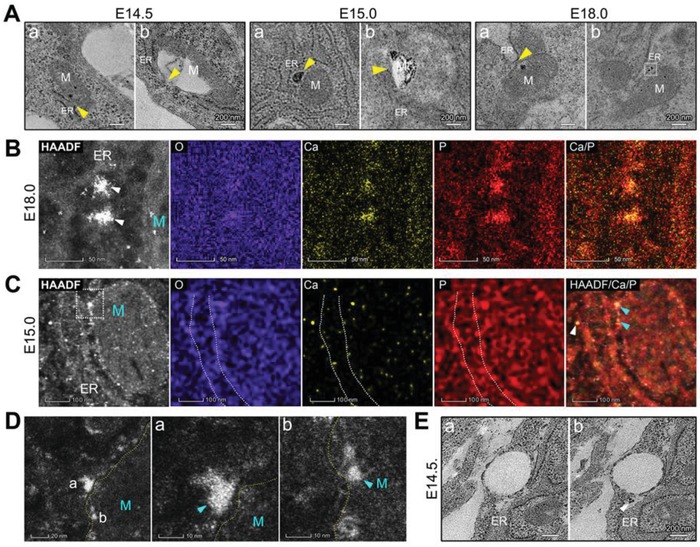
Figure 3.

TEM observations of ER–mitochondria associations in osteoblasts during mouse parietal bone development. A) TEM images of ER–mitochondria (M) associations (yellow triangles) at E14.5 (stained), E15.0 (unstained), and E18.0 (unstained). B) HAADF‐STEM EDS elemental mapping of the electron‐dense granules on ER membranes (white triangles) in (A, the outlined area). M: the mitochondria. C) HAADF‐STEM EDS elemental mapping of an osteoblast at E15.0. M: the mitochondria; white triangles: electron‐dense granules on or around the ER membranes (white‐dotted line); aquamarine triangles: electron‐dense granules on the outer mitochondrial membranes. D) HAADF‐STEM images of the outlined area in (C) Yellow‐dotted line: the outer mitochondrial membrane. E) Stained TEM images of two serial sections of parietal bone at E14.5. White triangle: granules on or around the ER.
