Figure 6.

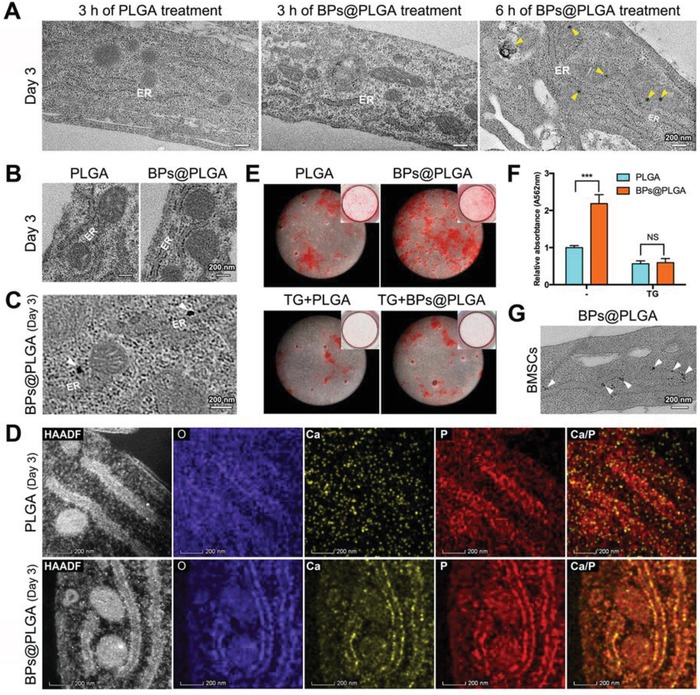
Calcium and phosphorus cluster transportation from the ER to the mitochondria. A) Unstained TEM images of PLGA‐ or BPs@PLGA‐treated osteoblasts. Yellow triangles: mitochondrial granules. B,C) Unstained TEM images of osteoblasts after 3 h of PLGA or BPs@PLGA treatment. White triangles: electron‐dense granules on the ER. D) HAADF‐STEM EDS elemental mapping of osteoblasts after 3 h of PLGA or BPs@PLGA treatment. E) ARS staining of BMSCs after 9 days of osteoinduction. F) Relative quantification of ARS staining in (E). ***p < 0.001; NS: not significant. G) Unstained TEM images of BMSCs after 3 h of BPs@PLGA treatment. White triangles: electron‐dense granules on the ER. The osteoblasts originated from BMSCs after 3 days of osteoinduction.
