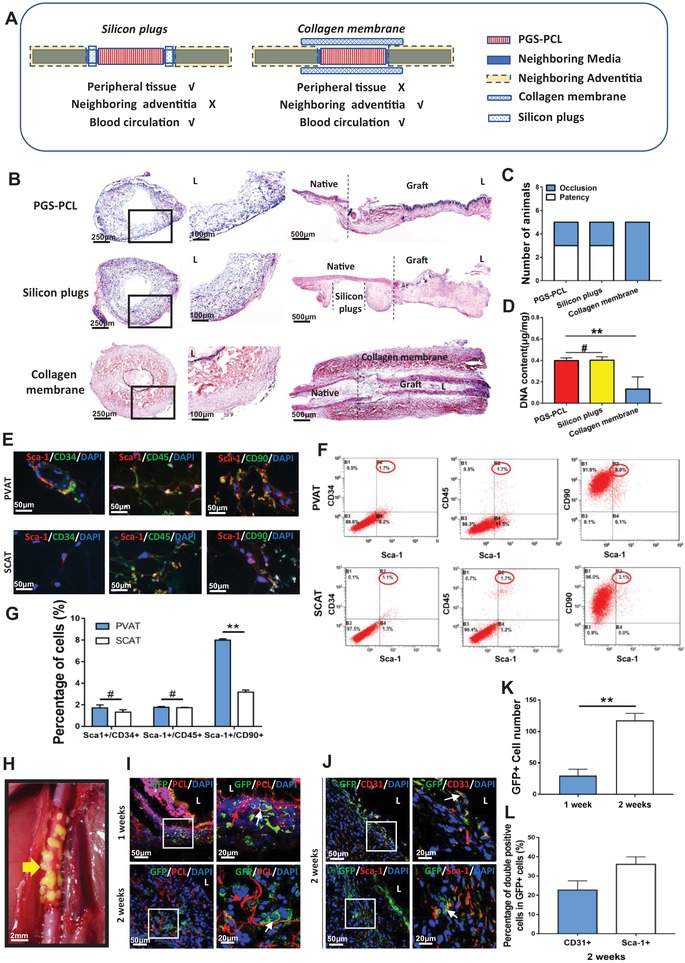
Figure 1.

Perivascular adipose provides vascular forming cells for arterial regeneration. A) Schematic illustration of wrapping collagen membranes and placing silicon plugs. B) H&E staining of neoarteries in PGS‐PCL, silicon plus, collagen membrane groups at 2 weeks postimplantation. C) Comparison of patency rate (n = 5 independent samples). D) Comparison of DNA content (n = 3 independent samples). E) Representative immunofluorescence images of Sca‐1+/CD34+ endothelial progenitor, Sca1+/CD45+ macrophage progenitor cells, and Sca‐1+/CD90+ vascular progenitor cells in PVAT and SCAT. DAPI was used to counterstain the nuclei. F) Flow cytometry images show the percentage of Sca‐1+/CD34+ cells, Sca‐1+/CD45+ cells and Sca‐1+/CD90+ cells in PVAT and SCAT. G) Quantification of Sca‐1+/CD34+ endothelial progenitor, Sca1+/CD45+ macrophage progenitor cells and Sca‐1+/CD90+ vascular progenitor cells in PVAT and SCAT through flow cytometry analysis (n = 3 independent samples). H) Perivascular adipose from GFP+ rat was transplanted around PGS‐PCL graft. Yellow arrow marks the grafted PVAT from GFP+ rat. I) Representative immunofluorescence images of the cross sections of PVAT transplanted grafts displaying GFP+ cells (green) recruitment into the PCL sheath (red) at 1 week and 2 weeks postimplantation. DAPI was used to counterstain the nuclei. J) Immunofluorescence staining images show the main components of GFP+ cells identified by CD31+ (top) and Sca‐1+ (bottom) at 2 weeks postimplantation. K) The number of GFP+ cells infiltrating into the grafts at different time points (n = 3 independent samples). L) The proportion of CD31+/GFP+ cells and Sca‐1+/GFP+ cells in GFP+ cells, respectively (n = 3 independent samples). Data are represented as the mean ± SD for each group. For D) significance was determined by one‐way ANOVA followed by Tukey's post hoc analysis. For (G) and (K), significance was determined by student t‐test. #: p > 0.05, **: p < 0.01.
