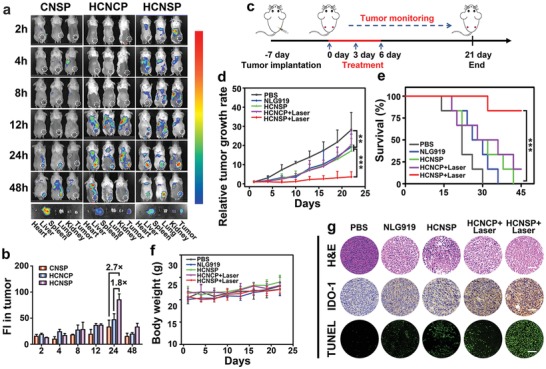
Figure 5.

Biodistribution and antitumor performance of the prodrug nanovectors in CT26 tumor‐bearing mice. a) Fluorescence imaging of CNSP, HCNCP, and HCNSP distribution in CT26 tumor‐bearing mice in vivo (Ex = 675 nm, Em = 720 nm). b) Semiquantitative analysis of prodrug nanovectors distribution in the tumors by fluorescence intensity. c) Therapeutic schedule for immune‐photodynamic combination therapy. d) Relative tumor growth curves, e) survival curve and f) the body weight change of CT26 tumor‐bearing mice following the indicated treatments (n = 6, mean ± s.d., **p < 0.01, ***p < 0.001). g) H&E staining, TUNEL staining and the immunohistochemical examination of IDO‐1 expression in the tumor sections at the end of the antitumor studies (scale bars = 100 µm).
