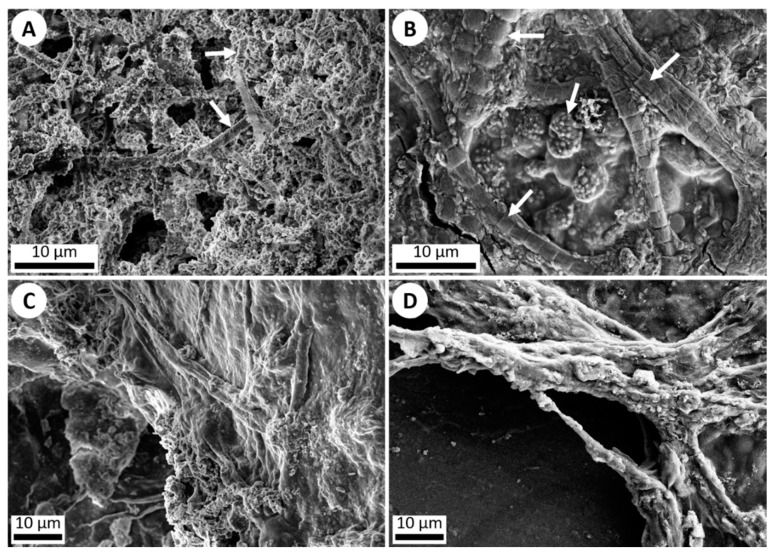
Figure 4.
SEM imagery of silica precipitation and microbial life. (A) ET-detector image (5 kV) of silica precipitation exhibited around individual microbes (white arrows) in a Yellowstone National Park hot spring outflow stream. (B) ET-detector image (5 kV) of silica precipitation exhibited around various microbes (white arrows) which were added onto a microscope slide and run through the hot spring simulation chamber for 1 week. Silica precipitation can be observed starting to cover the organisms. (C) ET-detector image (5 kV) of a dense microbial mat collected from an outflow stream in Yellowstone National Park, showing silica precipitation. (D) ET-detector image (10 kV) of a dense microbial mat of various non-hot spring cyanobacteria added onto a microscope slide and run through the hot spring simulation chamber for 1 week, once again exhibiting silica precipitation coating the mat.

