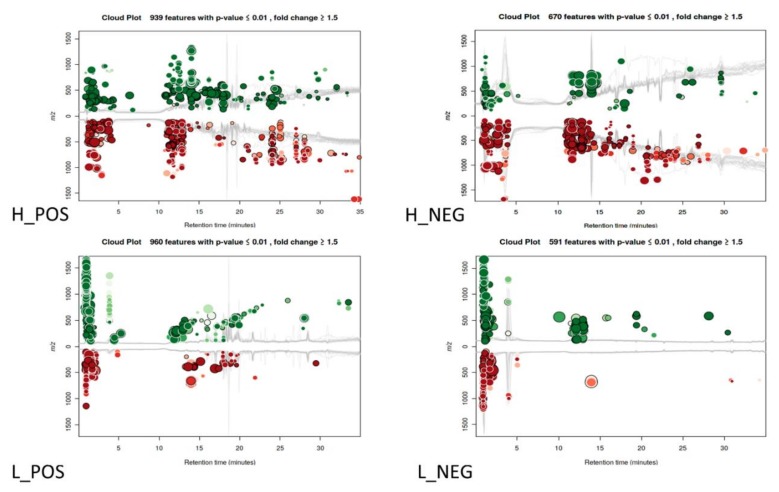
Figure 1.
Cloud plot analysis of hydrophilic (H) and lipophilic (L) Mtb whole cell extracts analyzed in positive (POS) and negative (NEG) mode. Fold change > 1.5; p < 0.01. The color of the bubble denotes directionality of fold change and the size of the bubble denotes the extent of the fold change. Green color represents up-regulated metabolite features, while red color represents down-regulated metabolite features.

