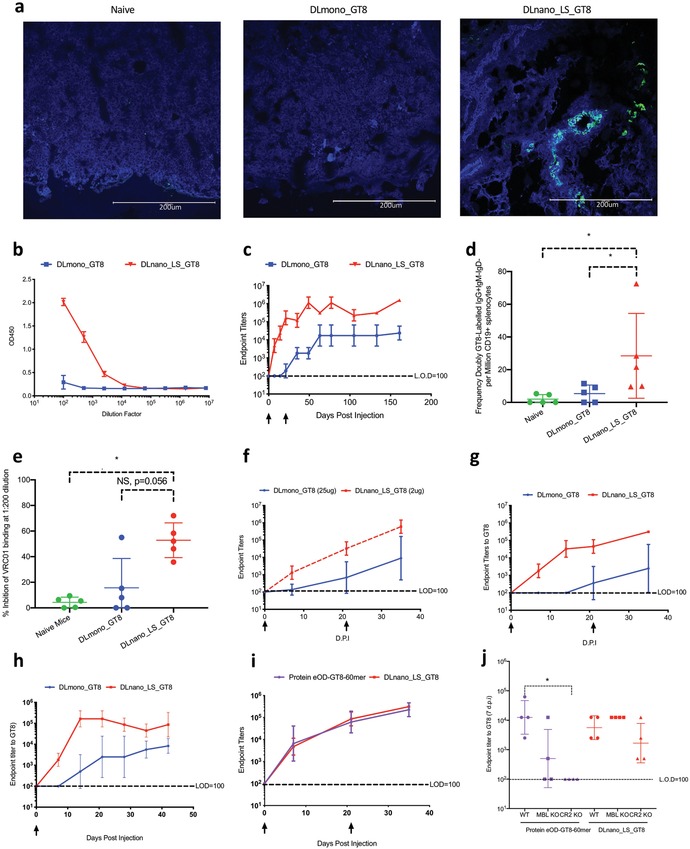
Figure 2.

Characterization of in vivo trafficking of DLnano_LS_GT8 and humoral responses induced by DLnano_LS_GT8 versus DLmono_GT8. a) Trafficking of DLnano_LS_GT8 and DLmono_GT8 7 d.p.i. in the draining lymph nodes, as determined by VRC01 staining (green) and anti‐CD35‐BV421 staining (blue) for co‐localization analyses. b) ELISA binding against monomeric GT8 using serum from female BALB/c immunized with DLmono_GT8 or DLnano_LS_GT8 7 d.p.i. c) Endpoint titers to GT8 over time using serum from female BALB/c receiving two immunizations of DLmono_GT8 or DLnano_LS_GT8 3 weeks apart. d) Frequencies of CD19+IgM‐IgD‐IgG+ GT8‐specific B‐cells in the spleen of naïve female BALB/c mice or female BALB/c mice immunized with two doses of DLmono_GT8 or DLnano_LS_GT8 5 weeks after the second immunization. e) Percentage inhibition of VRC01‐GT8 binding by naïve mice sera or post‐immune sera from the DLmono_GT8 or DLnano_LS_GT8 vaccinated mice at 1:200 dilution. f) Comparison of GT8 endpoint titers for female BALB/c mice receiving two doses of DLmono_GT8 at 25 µg dose or DLnano_LS_GT8 at 2 µg dose. g) Comparison of GT8 endpoint titers for male BALB/c mice receiving two doses of DLmono_GT8 or DLnano_LS_GT8 at 25 µg dose. h) Comparison of endpoint titers in guinea pigs receiving single 50 µg intradermal immunization of DLmono_GT8 or DLnano_LS_GT8. i) Comparison of humoral responses induced by protein eOD‐GT8‐60mer adjuvanted by Sigma Adjuvant System or DLnano_LS_GT8 as assessed in C57BL/6 mice. j) Humoral responses in wildtype C57BL/6, MBL KO, or CR2 KO mice to protein eOD‐GT8‐60mer (purple) and DLnano_LS_GT8 vaccinations (red) 7 d.p.i. A total of 80 µg of plasmid DNA used in panel (a) and 25 µg plasmid DNA and 10 µg recombinant protein used elsewhere in the figure unless otherwise specified. Each group except in panel (j) includes five animals; each group in panel (j) includes four animals; each dot represents an animal; error bar represents standard deviation; arrow below the plot represents an immunization; two‐tailed Mann–Whitney rank test was used to compare groups; p‐values were adjusted for multiple comparison where appropriate; *p < 0.05.
