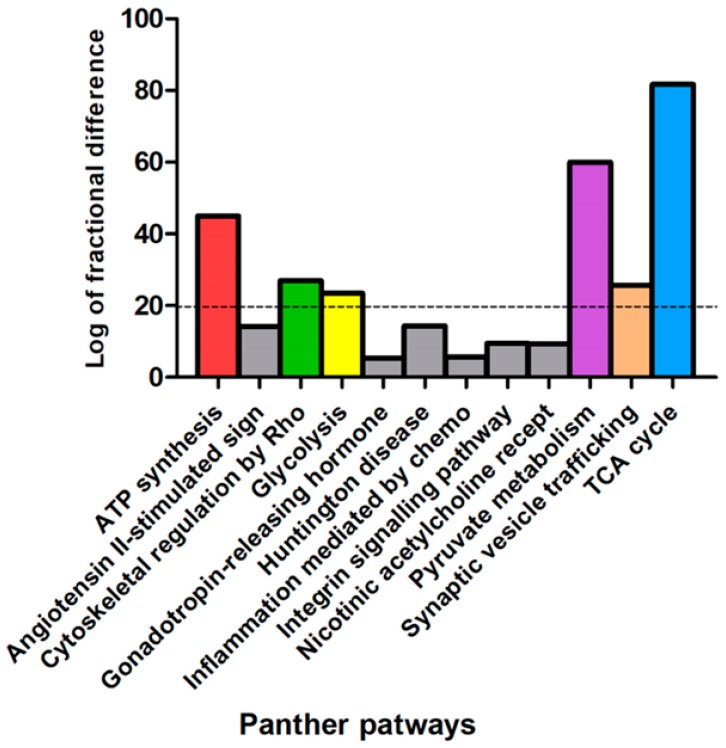
Figure 2.
PANTHER pathways classification of murine NAGLU−/− brain tissue proteome. The dysregulated proteins in NAGLU−/− brain versus murine WT brain proteomes were clustered according to their cellular pathways using the Protein Analysis Through Evolutionary Relationship (PANTHER) software. The PANTHER pathways graphical enrichment (y-axis) was associated to each cellular pathway (x axis). The PANTHER cellular pathways were listed according to enriched values, expressed as the log of fractional difference (observed vs expected): (number of genes for the category – number of genes expected) / (number of genes expected).

