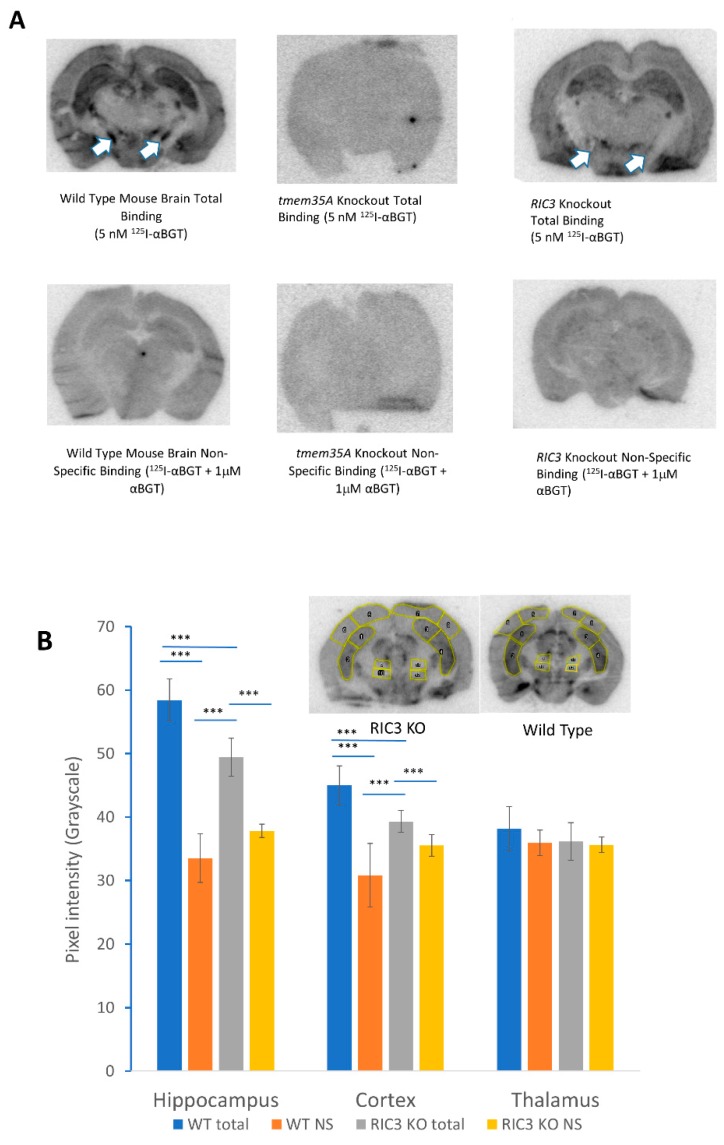
Figure 5.
(A) Autoradiographic comparison of 125I-αBGT binding between wild type and KO animal brain slices. Top row shows total binding for wild type (left), tmem35a KO (middle) and ric3 KO (right) brain sections. The bottom row shows corresponding non-specific binding. There was no specific binding in tmem35a KO, and significant loss of binding in specific brain structures in the ric3 KO brains (arrows). (B) Autoradiographic analysis of 125I-αBGT binding using ImageJ. Significant loss of toxin binding was observed in the hippocampus and cortex of the ric3 KO compared to the corresponding structures in wild type (WT) animals (Specific binding is the difference between total binding and non-specific [NS] binding). The insets show typical sections and the areas used for analysis over two sections per condition (N = 8 areas per brain region, with a medial and lateral area for each brain side times two sections). This analysis was done on one experiment comparing one animal per condition since the two experiments performed so far were done using different batches of 125I-αBGT with different specific activities and slightly different exposure times and are not easily comparable. Error bars represent standard deviations. *** p > 0.001, (**p < 0.01, * p < 0.05) by single factor ANOVA.

