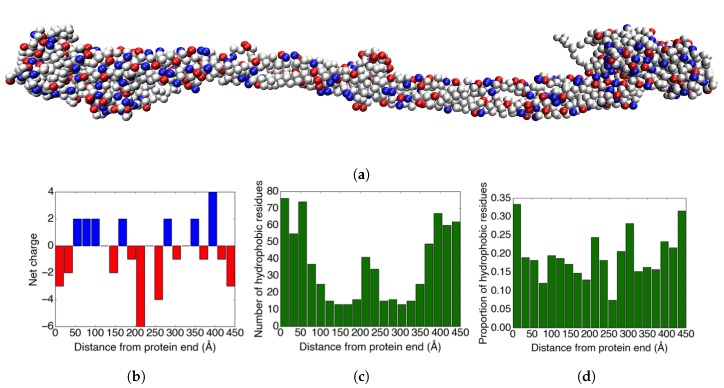
Figure 2.
(a) An image of the coarse-grained fibrinogen body from the crystal structure. The red amino acid residues are negatively charged, the blue residues are positively charged, and grey represents neutral residues. (b) The charge distribution in the longitudinal direction of the fibrinogen crystal structure. (c) The distribution of hydrophobic amino acid residues in the longitudinal direction of the fibrinogen crystal structure. (d) The proportion of the ≥20% solvent-accessible amino acid residues that are hydrophobic for each bin.

