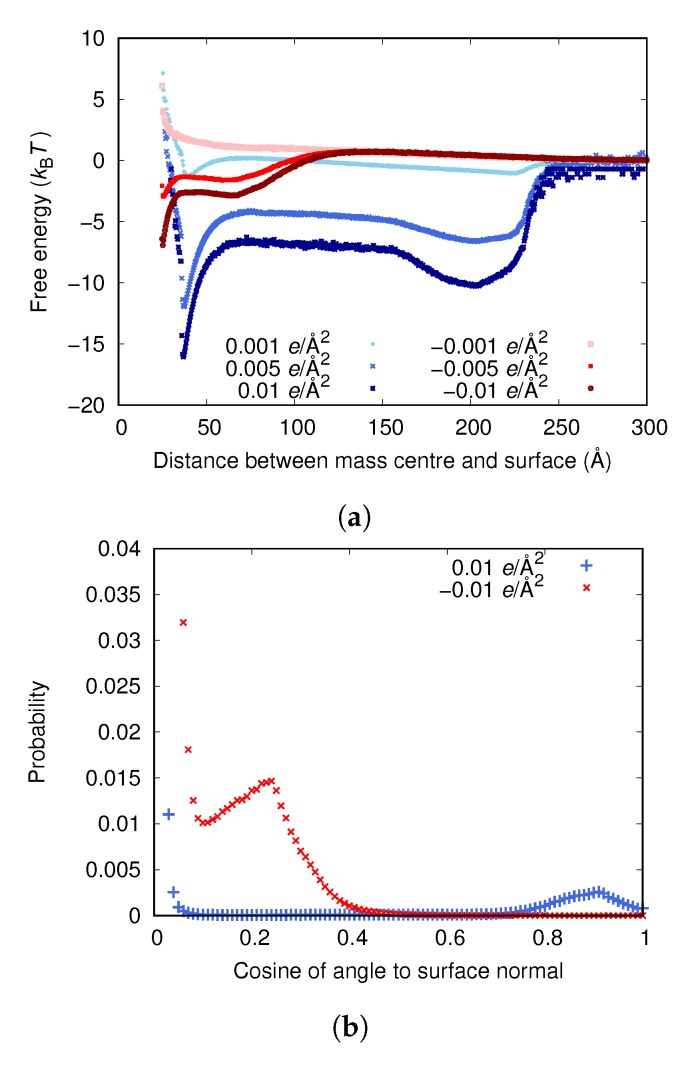
Figure 3.

(a) The adsorption free energies for the fibrinogen main body to surfaces with different surface charge densities. (b) Distribution of cosine of the angle between the surface normal and an adsorbed protein for the higher surface charge densities. (The upper limit of the y-axis has been set so that it is possible to view peaks other than the ones for small cosine.) (c) A configuration with cosine close to 0, corresponding to the deepest free energy well when the surface charge is /Å. (d) A configuration with high cosine, corresponding to the second free energy well when the surface charge is /Å.

