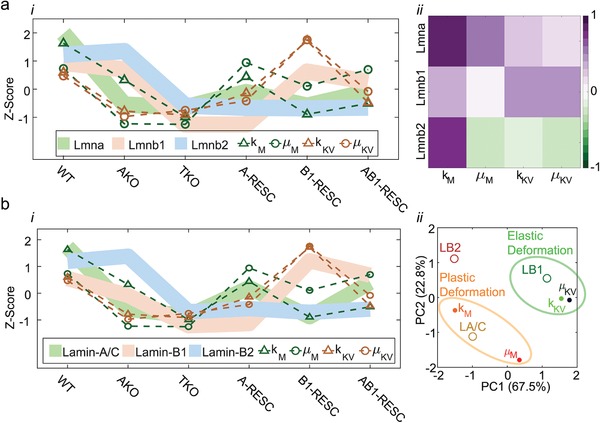
Figure 3.

Expression profiles of Lamin‐A cluster with nucleus viscosity and Lamin‐B1 with nucleus stiffness. The standardized z‐score profiles of the four Burgers elements are plotted across all MEF nuclei together with the z‐score profiles of a) lamins' mRNA levels (RNA‐Seq) and b) lamins' protein levels (averaged across IF, WB and MS, Figure S1, Supporting Information. Changes in k_M and µ_M overlap with Lamin‐A/C (green) both at the a‐i) RNA and the b‐i) protein levels. Changes in k_KV and µ_KV weakly overlap with Lmnb‐1 (brown) at the mRNA and the protein levels. a‐ii) Pearson coefficients of correlation are calculated between lamin gene expression levels and the Burgers elements. Maximal correlations of k_M and µ_M are obtained with Lmna and of k_KV and µ_KV with Lmnb1. b‐ii) At the protein level, principle component analysis establishes associations between k_M and µ_M with Lamin‐A/C and between k_KV and µ_KV with Lamin‐B1. In accordance with the Maxwell module and the Kelvin‐Voigt module, lamin‐A/C dominates plastic deformation (orange) and lamin‐B1 dominates elastic deformation (green) of the nucleus in response to applied stress.
