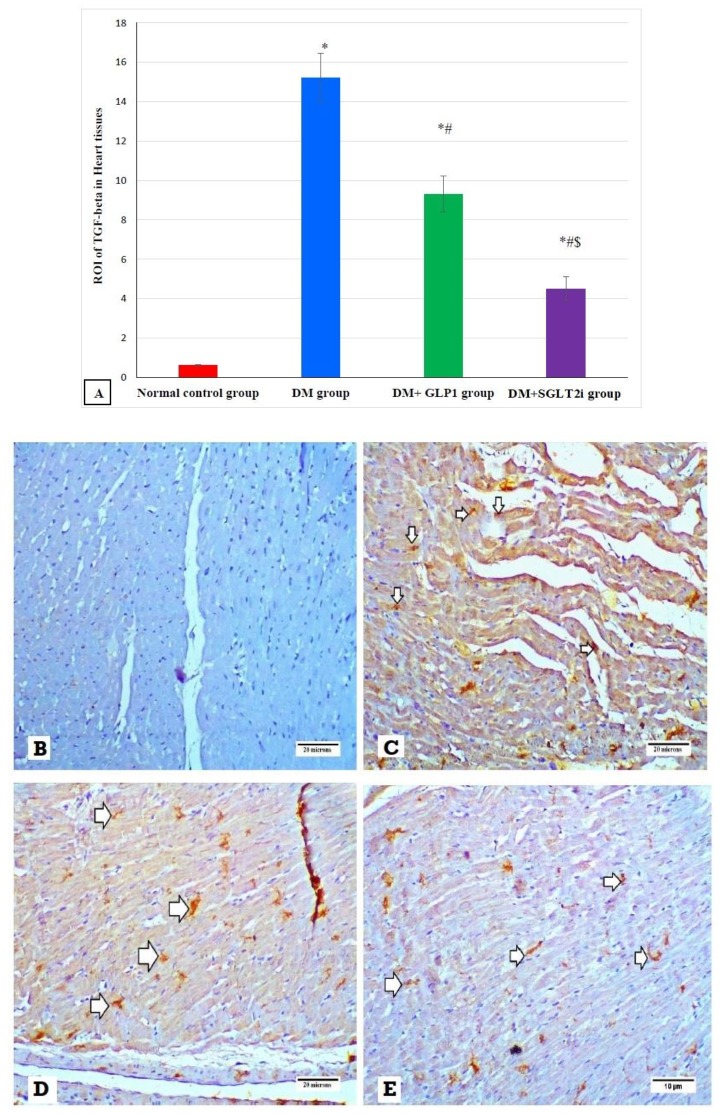
Figure 7.
The expression of TGF-β by immunostaining in different groups. (A) Graphs of ROI of the expression of TGF-β in different groups. Heart specimens showing (B) negative TGF-β expression (control group), (C) marked membranous expression of TGF-β within the interstitial tissue between fibers (arrows) (DM group), (D) moderate membranous expression of TGF-β (arrows) (DM + GLP1 group), and (E) minimal membranous expression of TGF-β (arrows) (DM + SGLT2i group). * Significant vs. control group, # significant vs. DM group and $ significant vs. GLP1 group.

