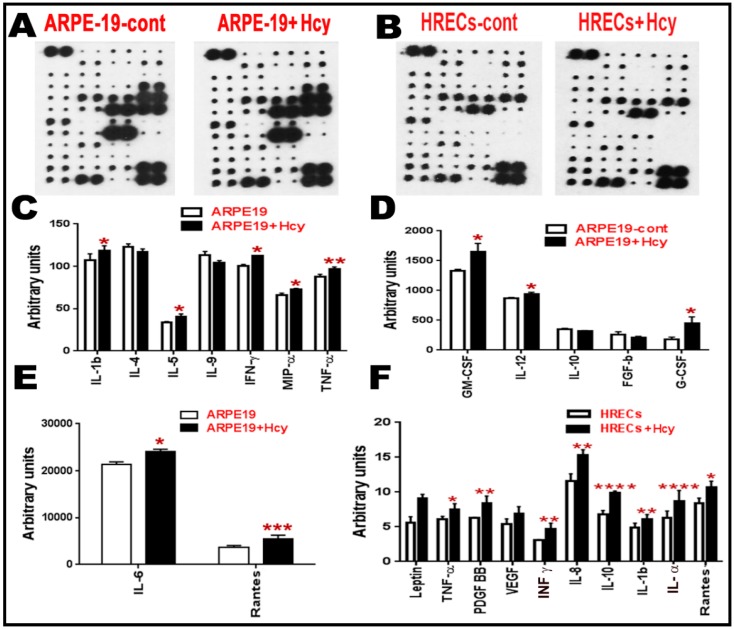
Figure 4.
Cytokine array analysis for retinal cells treated with Hcy for 24 h. (A–F) Cytokine array analysis of ARPE cells and HRECs treated with Hcy for 24 h. (A,B) Membranes showing the change in the inflammatory cytokines. The intensities of the spot were quantified densitometrically and compared to the density of the internal standards, yielding an integrated density value (IDV) for each cytokine. (C–E) Analysis showing significant increase of pro-inflammatory cytokines (IL-1β, IL5, IFN-γ, MIP-α, TNF-α, GM-CSF, IL-12, G-CSF, IL6, and Rantes) and downregulation of anti-inflammatory cytokines (IL-4 and IL10) when ARPE-19 cells were treated with 100 µM Hcy for 24 h. (F) HRECs treated with Hcy-50 µM for 24 h showed significant increase in pro-inflammatory and pro-angiogenic cytokines (TNF-α, PDGF BB, IFN-γ, IL8, IL10, IL-1 β, IL-α, and Rantes) and a marked increase in leptin and VEGF. Data are expressed as mean ± SD. (* p < 0.05, ** p < 0.01, *** p < 0.001, **** p < 0.0001).

