
Figure 2.
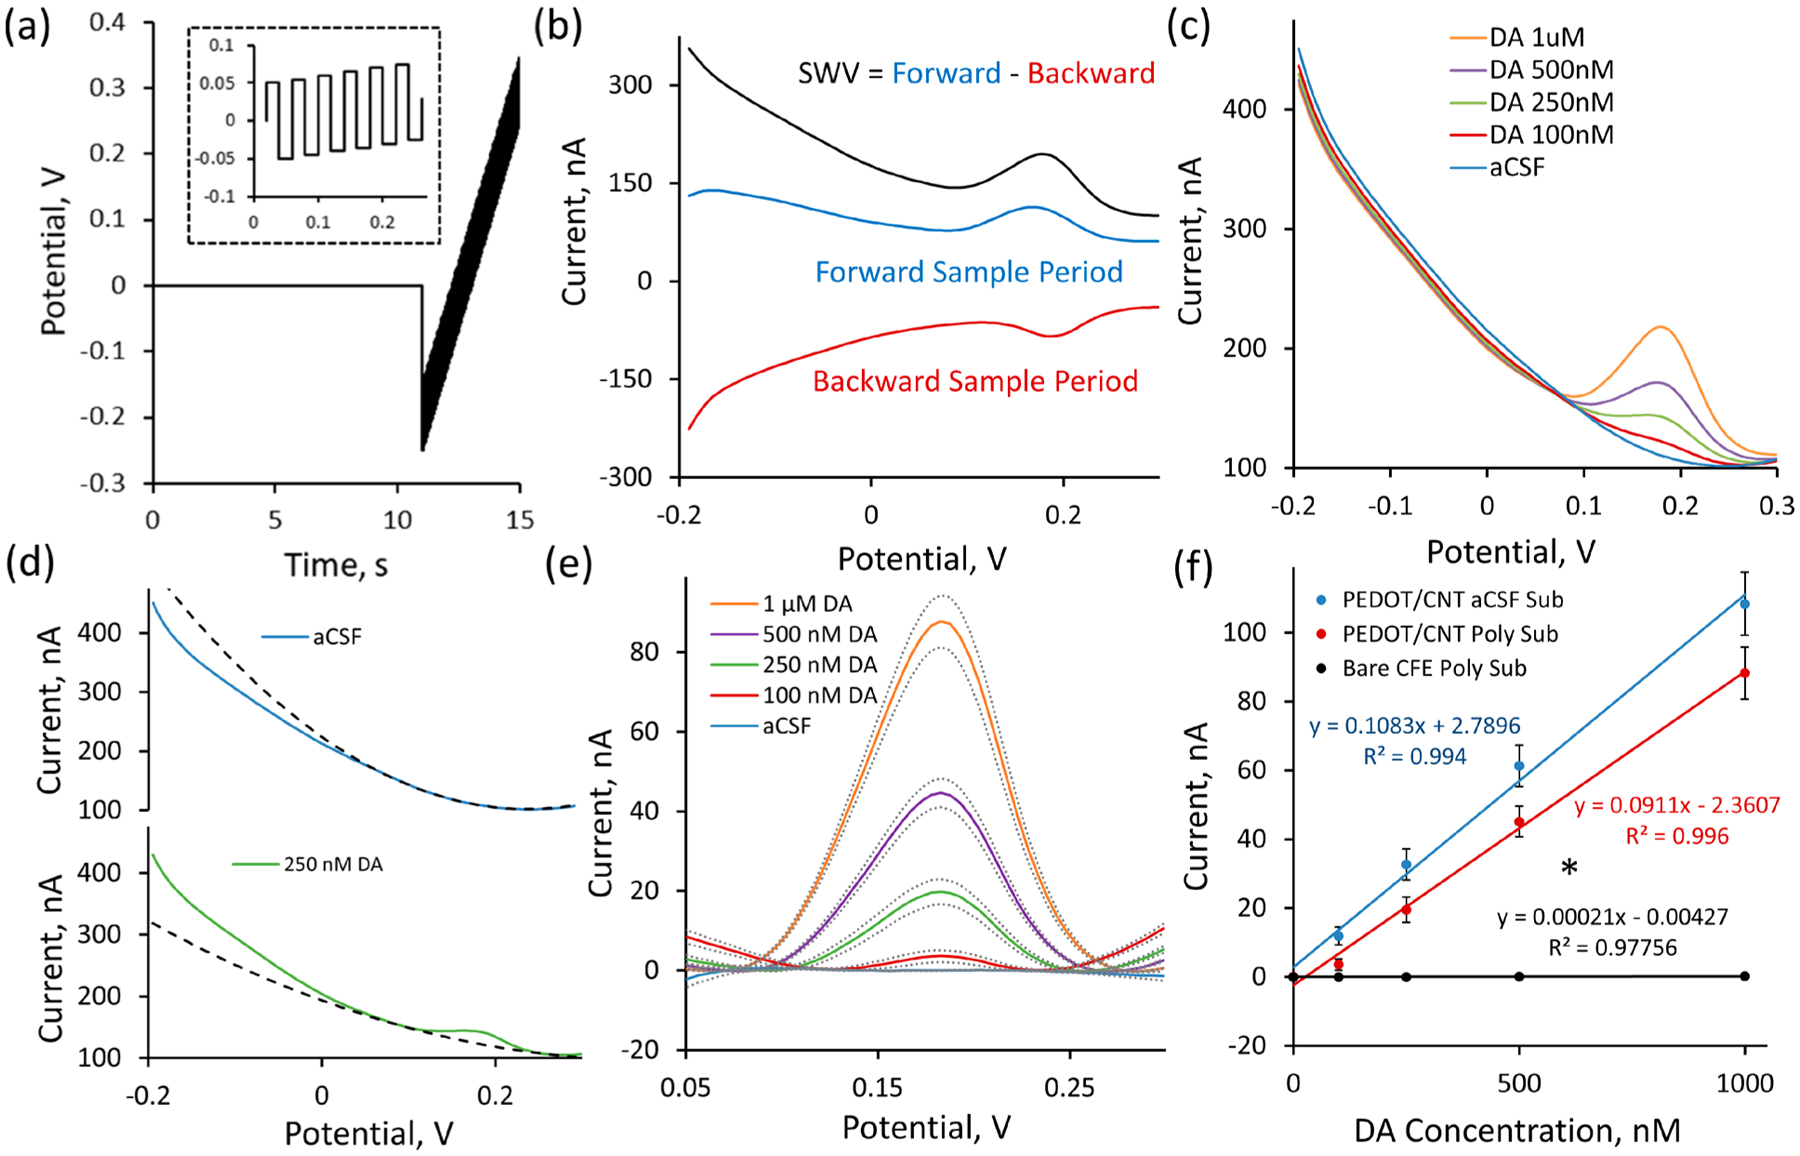
PEDOT/CNT-functionalized CFEs are sensitive for resting DA via SWV. (a) The SWV waveform consists of an initial 0 V hold followed by a series of anodic and cathodic step and holds (zoom shown in the inset) that transverse the defined potential window. Forward current is measured at the end of each anodic hold period, and backward current is measured at the end of each cathodic hold period. (b) Representative SWV measurement of a 1 μM standard solution of DA reveals the SWV current response to be the difference of the forward and reverse current responses. (c) Average (n = 5, SEM omitted for clarity) in vitro SWV DA calibrations conducted at PEDOT/CNT-functionalized CFEs in aCSF reveal clear DA peaks at 0.18 V. (d) A second-order polynomial was used to model the background current for each SWV response within the potential region of interest (surrounding Epeak 0.18 V). The polynomial fit (dashed) produces a high-correlation fit within the potential region of interest to individual SWV traces (average SWV responses shown) both in the presence (250 nM DA, green) and absence (blue, aCSF) of DA. (e) Subtraction of the polynomial baseline fit reveals clear concentration-dependent Gaussian peaks (average ± SEM) for solutions containing DA and nearly flat baselines in solutions where DA is absent. (f) Average DA sensitivity (background-subtracted peak current vs DA concentration) is linearly correlated. Incorporating PEDOT/CNT coating significantly increases DA sensitivity (* one-way ANOVA, p < 0.05) from bare CFEs (black). Average sensitivity of PEDOT/CNT-functionalized CFEs following polynomial background subtraction (red) is not significantly different from the sensitivity obtained via aCSF subtraction (blue) (one-way ANOVA, p > 0.05).