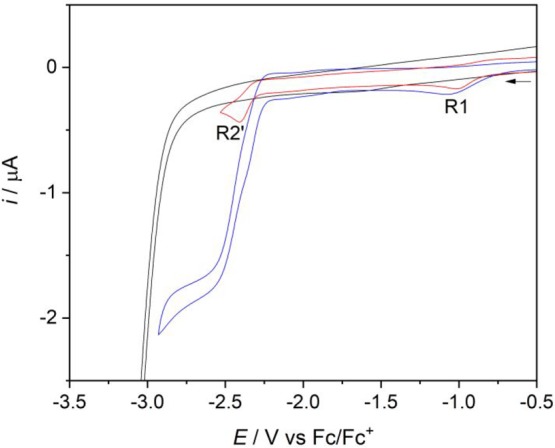
Figure 12.

CVs of [Re(3,3′-DHBPY)(CO)3Cl] in THF/Bu4NPF6 saturated with argon (red curve) and CO2 (blue curve). The black curve represents the background CV of CO2 dissolved in the electrolyte. Experimental conditions: Pt microdisc, T = 298 K, v = 100 mV s–1.
