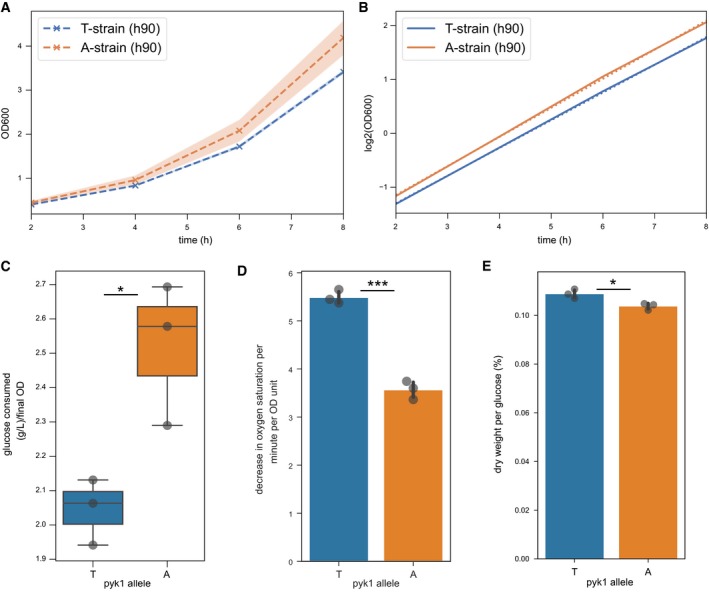
Figure 4. Physiological characterisation of pyk1 variant.

- Growth measured by optical density (OD) at 600 nm for 3 biological replicates each of the T‐ and A‐strains over 6 hrs of exponential growth in YES media. The x‐axis refers to the time since inoculation of the culture.
- The same data as in (A) plotted on a log2 scale (solid lines) with lines fitted (dotted lines). The doubling time is the inverse of the slope.
- Media samples were taken from the same cultures (n = 3 for both strains) at the 8 hr timepoint and the remaining glucose was quantified. The consumed glucose was calculated based on the amount of glucose measured in the same, fresh media and normalised to the OD of each culture at the time of sampling.
- Oxygen consumption rates in A‐ and T‐strains (ratio of means = 0.65, P = 0.0002, Welch's t‐test, three biological replicates, each measured in technical duplicates).
- Culture dry weight after 24 h was measured reported as a fraction of the weight of glucose put into the media for three biological replicates per strain.
