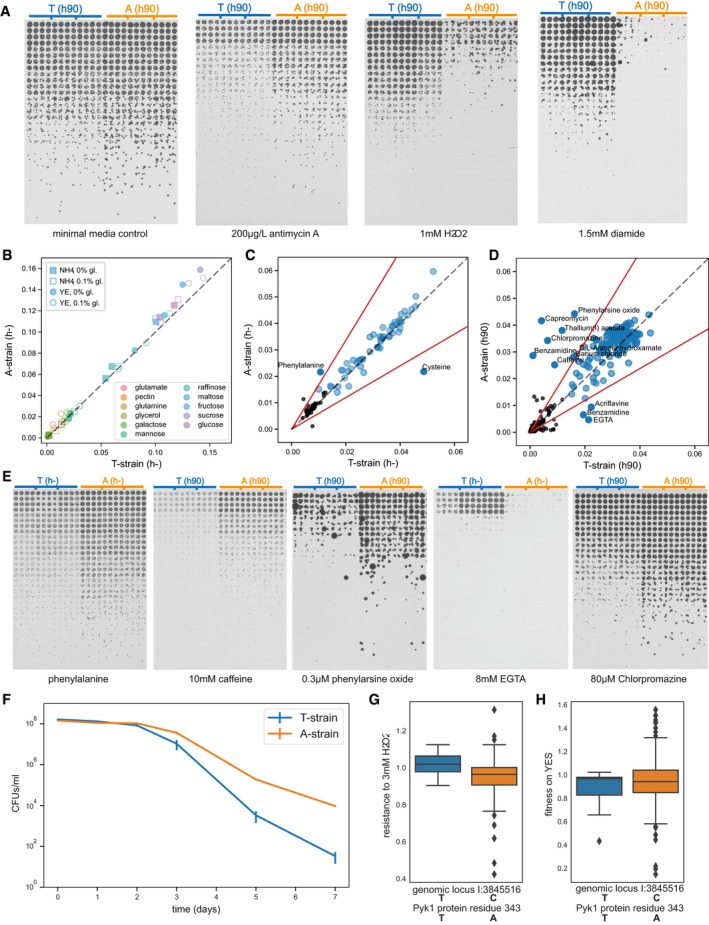
Spot assays on solid media from a threefold dilution series of exponential cultures at the same cell density in 96‐well plates (3 biological replicates of each strain) and spotted in 16 technical replicates (each dilution in 4 × 4 square). The A‐strain is more resistant to antimycin A but less resistant to oxidative stress triggered by H2O2 or diamide. A control without toxin (left) was included in each batch of spot assays performed and a representative image is shown here.
Fitness (approximated by maximum slope of smoothed growth curves) of A‐ and T‐strains on 12 carbon sources, with either yeast extract (YE) or ammonium (NH4), with or without 0.1% priming glucose to support initial growth. For all 48 conditions, two biological replicates of A‐ and T‐strains were grown in technical quadruplicates each. Dotted lines in panels B‐D mark a fitness ratio of 1 (i.e. same fitness).
Fitness of A‐ and T‐strains on 95 nitrogen sources on Biolog Phenotype MicroArrays. Conditions with no substantial growth were excluded (black circles, maximum slope < 0.015). Red lines show arbitrary significance cut‐off, put at |log2(A‐strain/T‐strain)| > 0.75.
Fitness of A‐ and T‐strains on 72 different drugs and toxins, at 4 concentrations each, on Biolog Phenotype MicroArrays. Graph details and cut‐off as in (C). (Results for benzamidine were inconclusive, with both strains comparatively resistant in one concentration each.)
Spot assays as in (A) to validate selected results from (C) and (D). Several assays were performed with both h‐ and h90 strains, and no mating‐type‐specific differences were evident between the two sets of allele swap strains.
Chronological lifespan of A‐ and T‐strains, i.e. the proportion of non‐dividing cells in stationary phase that maintain proliferative potential after refeeding. The data show colony forming units (CFUs) per ml of culture over 7 days of stationary phase in glucose‐depleted rich media. Three biological repeats were carried out for both strains, with each repeat measured as technical triplicates. Error bars represent standard error of the biological replicates.
Boxplot showing resistance to 3 mM H2O2 grouped by pyk1 allele for 156 strains from our collection. The T‐strains had a higher mean fitness in H2O2 than the A‐strains (1.01 ± 0.06 vs. 0.95 ± 0.11; P = 0.0021, Welch's t‐test). The resistance score was obtained as for antimycin A.
Boxplot showing growth fitness on rich media, grouped by pyk1 allele for 158 S. pombe strains (0.88 ± 0.16 vs. 0.94 ± 0.24; P = 0.18, Welch's t‐test).

