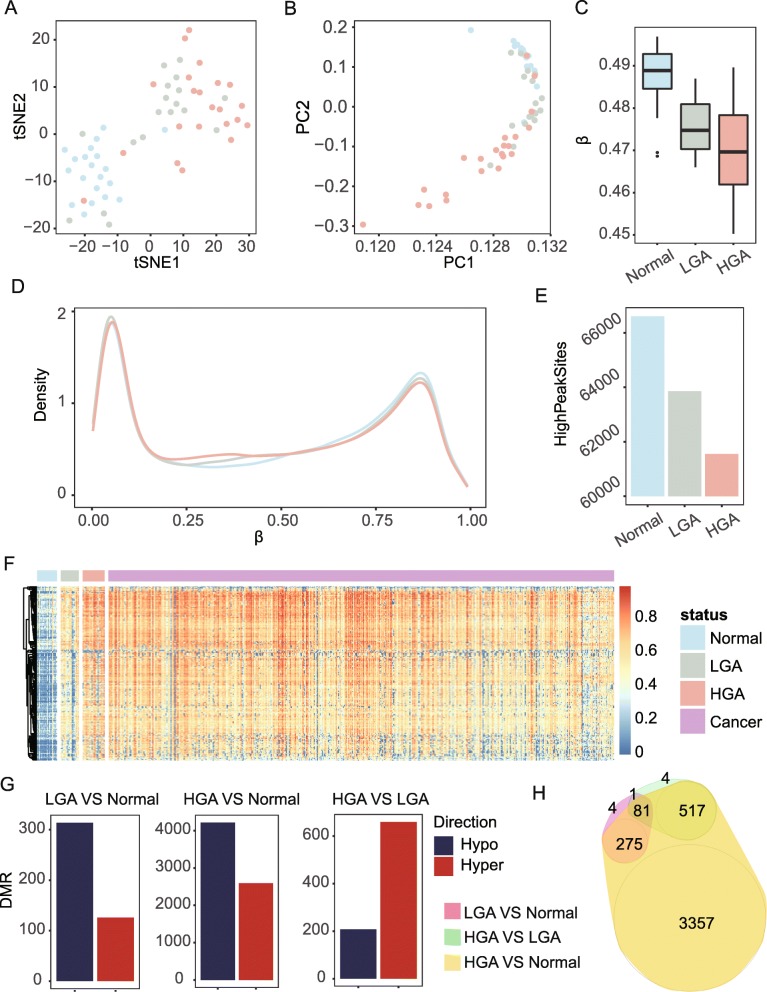
Fig. 1.
Genome-wide DNA methylation of low-grade adenoma (LGA), high-grade colorectal adenoma (HGA), and normal colorectal tissue. a t-SNE analysis highlights the data structure and sample relationship among the sample groups. b PCA analysis confirms the data structure and sample relationship of the t-SNE analysis. c Average methylation levels of normal (N), LGA, and HGA samples. d Density plot reveals the distribution of the whole array probes for N, LGA, and HGA samples. e Number of sites in β ranging from 0.7 to 0.9. f Heatmap of the 209 hyper-methylated DMSs of in-house datasets and samples from 504 public cancer datasets. g DMR between LGA and normal tissues, HGA and normal tissue, and HGA and LGA. h Venn graph highlights the relationships among all DMRs

