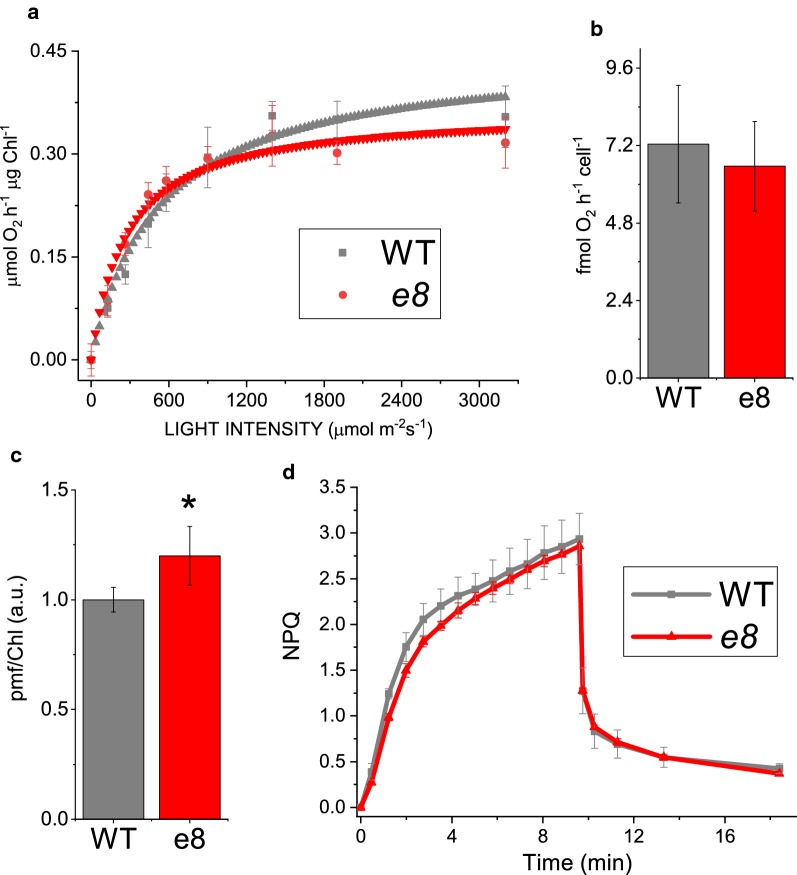
Fig. 3.
Photosynthetic parameters of e8 mutant compared to WT. a Net oxygen production of wild type and e8 mutant strain normalized to chlorophyll content, measured at different actinic light intensities. Experimental data were fitted with hyperbolic function. b Dark respiration rate normalized to cell content. c Non-Photochemical Quenching (NPQ) formation and relaxation in wild type and e8 mutated strain, actinic light 1500 μmol photons m−2 s−1. d Proton motive force (pmf) for wild type (WT) and e8 obtained by electrochromic shift measurement (ECS) at 1000 μmol photons m−2 s−1 and normalized to the chlorophyll content. Errors are reported as standard deviation, the statistical significance of differences between WT and e8 is indicated as * (p < 0.05), as determined by unpaired two-sample t-test (n = 4)

