Fig. 4.
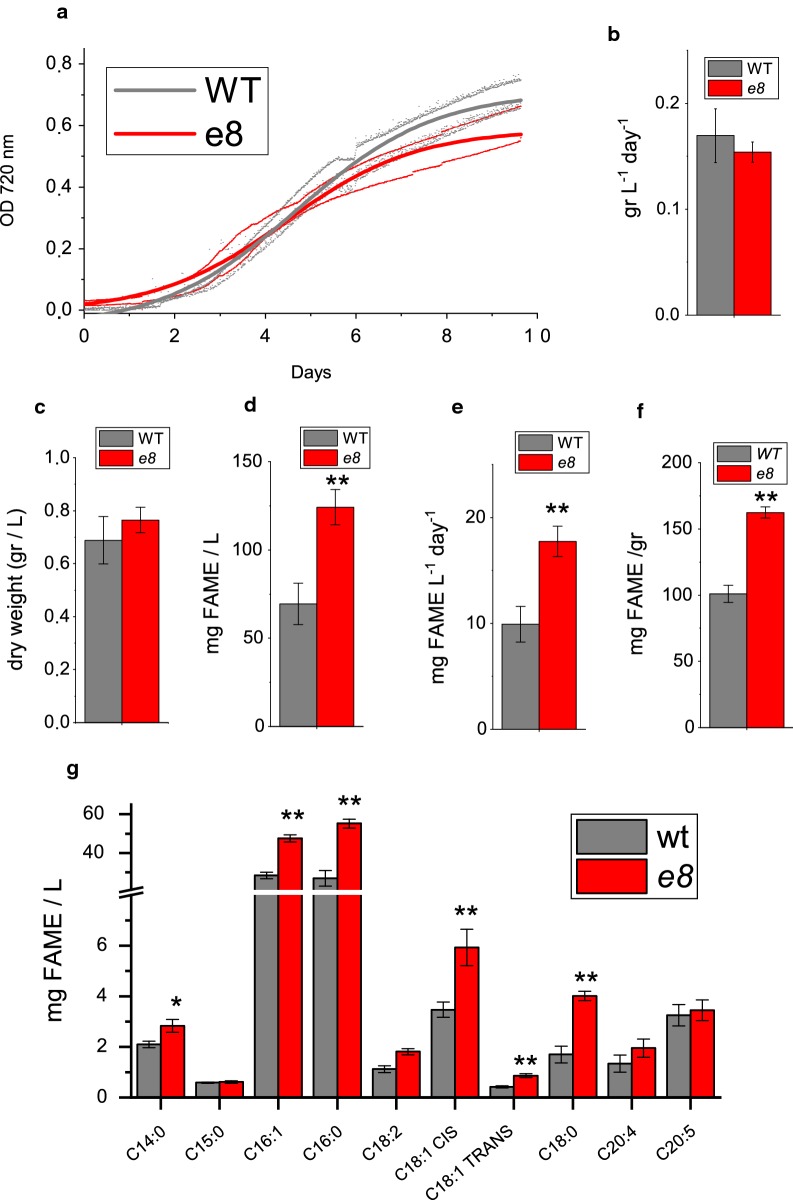
Biomass and lipid productivity of wild type and e8 mutant. a Growth curves of WT and e8 mutant obtained measuring the optical density at 720 nm. b Maximum daily productivity in terms of gr L−1 day−1. c Dry weight at the end of the growth curve (g/L). d, e FAME content in terms of mg of lipids per liters of culture (d) or mg of lipids per gram of dry weight (e). f FAME productivity in terms of mg of lipids per liters of culture per day. g Acyl chain composition of lipid fraction from WT and e8 mutant. Errors are reported as standard deviation, significantly different values are marked with * if p < 0.05 and ** if p < 0.01, as determined by unpaired two-sample t-test (n = 3)

