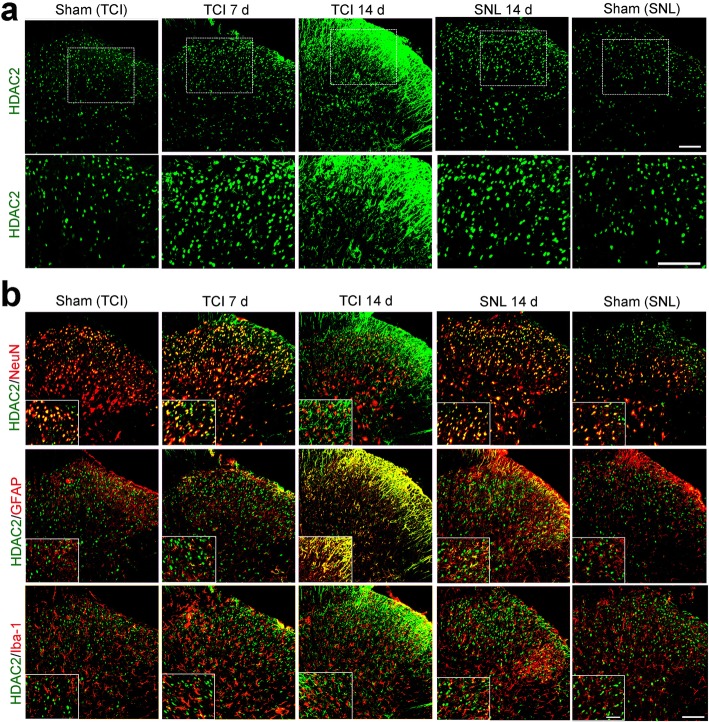
Fig. 4.
TCI-induced upregulation of HDAC2 in the spinal dorsal horn following TCI or SNL. a Immunofluorescent staining of HDAC2 in the spinal dorsal horn at various time points (Sham, POD 7 and POD 14 for TCI; Sham and POD 14 for SNL). Scale bar = 100 μm. b Double immunofluorescent staining showing the co-localization of HDAC2 (green) with neurons (NeuN, red), astrocytes (GFAP, red), and microglia (Iba-1, red) at various time points (Sham, POD 7 and POD 14 for TCI; Sham and POD 14 for SNL). Scale bar = 100 μm (outside); 50 μm (inside)

