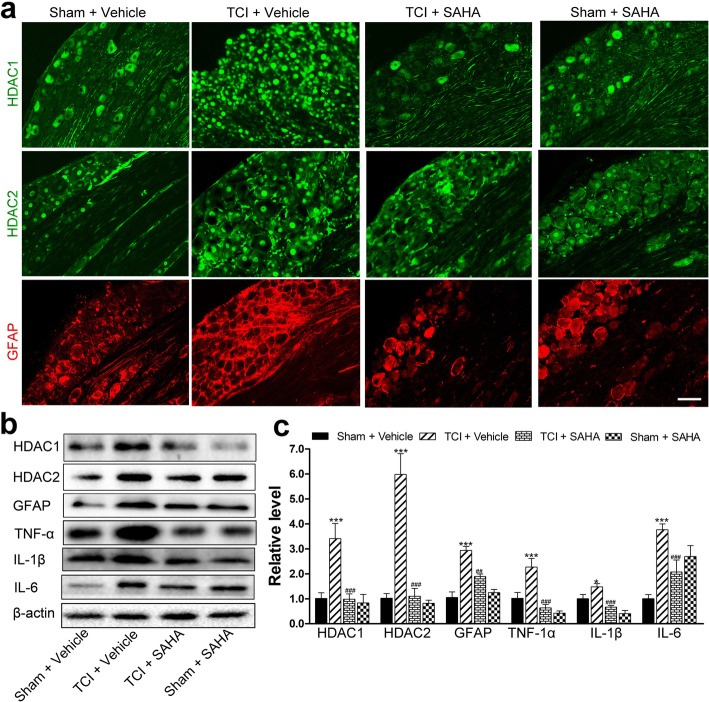
Fig. 7.
The effects of SAHA on TCI-induced neuroinflammation in the dorsal root ganglia. a Immunofluorescent staining of HDAC1 (green), HDAC2 (green), and GFAP (red) in the dorsal root ganglia of the Sham + vehicle, the TCI + vehicle, the TCI + SAHA, and the Sham + SAHA group on POD 21. Scale bar = 100 μm. Representative bands (b) and quantitative analysis of HDAC1, HDAC2, GFAP, TNF-α, IL-1β and IL-6 (c) in the dorsal root ganglia of Sham + vehicle, the TCI + vehicle, the TCI + SAHA and the Sham + SAHA group (n = 4). Analysis was based on the mean gray values and normalized to β-actin. Data are expressed as mean ± SEM. *p < 0.05 and ***p < 0.001 versus the Sham + vehicle group, and ##p < 0.01, ###p < 0.001 versus the TCI + vehicle group

