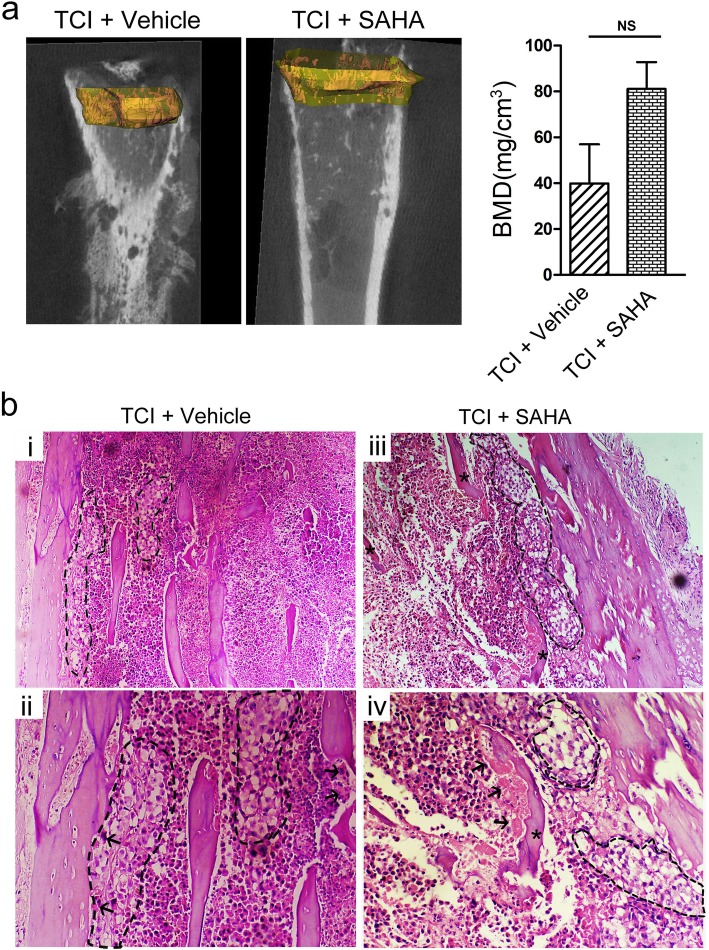
Fig. 8.
The effect of SAHA administration on bone destruction following TCI. a 2D representative MicroCT images of trabecular bone microarchitecture. b Quantitative analysis of the BMD in tibia of the TCI + vehicle and the TCI + SAHA group (n = 4). Data are expressed as the mean ± SEM. Representative images of HE staining showing cancer cell infiltration (cells within the dotted lines) and bone resorption pits (arrows) on trabecular surface in tibial marrow cavity of the TCI + vehicle (b (i, ii)) and TCI + SAHA (b (ii, iii)) group. Original magnification: 100 (upper row), 200 (bottom row)

