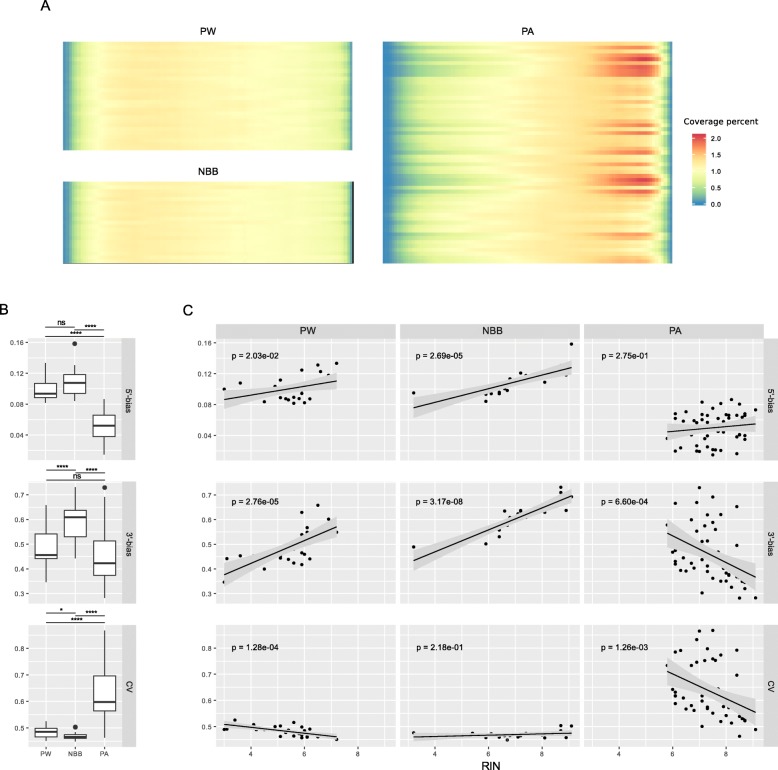
Fig. 1.
Transcript coverage profiles of Ribo-Zero datasets compared to poly(A). a Heatmaps of transcript coverage in our two cohorts (PW, NBB) and a poly(A) dataset (PA). The y-axis shows samples sorted by RIN (top: lowest RIN; bottom highest RIN). The x-axis represents the transcript body percentiles (5′ to 3′). The shading for a given row represents the sample-normalized coverage averaged across all transcripts. b Boxplots for different coverage quality metrics: median 5′-bias, median 3′-bias and median coefficient of variation (CV) for each cohort. The bias metric is calculated by Picard tools on the 1000 most highly expressed transcripts and corresponds to the mean coverage of the 3′(or 5′)-most 100 bases divided by the mean coverage of the whole transcript. Values closer to 1 indicate absence of bias, while values departing from 1 indicate a coverage bias (asterisks indicate significance at (*) p > 0.05, (**) p ≤ 0.01, (***) p ≤ 0.001, (****) p ≤ 0.0001, Wilcoxon test). The same metrics are expanded in (c), with sample scatterplots showing RIN values against the coverage quality metrics. Linear regression trends are indicated with black lines. P-values for the F-statistic of the linear model are also shown in the panels. Panels are organized in columns (cohorts) and quality metrics (rows). CV = coefficient of variation; PW = ParkWest cohort; NBB = Netherlands Brain Bank cohort; PA = poly(A) cohort

