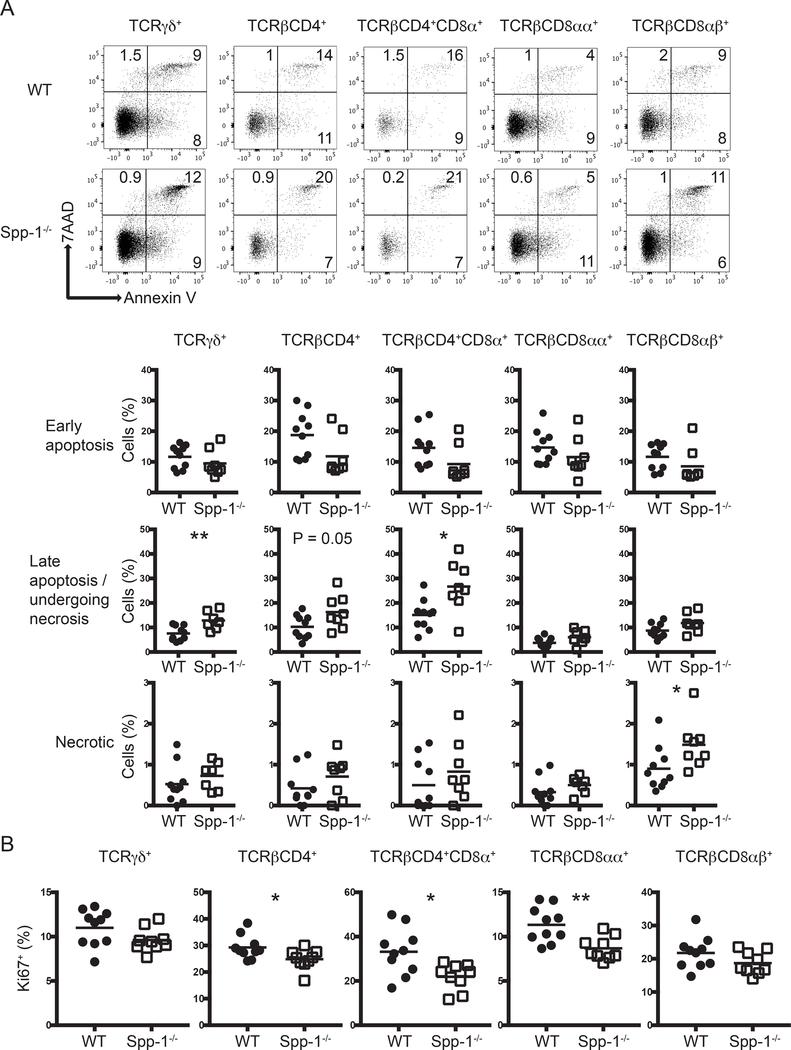
Figure 2.
Differential apoptosis and cell division in IEL from osteopontin-deficient mice. (A) Annexin V staining of different small intestine IEL populations derived from WT and Spp-1−/− mice. After gating cells by size based on forward and side scatter profiles, cells were gated for the expression of CD45 and other surface markers as indicated in Fig. 1A, and then analyzed for annexin V and 7AAD staining. Dot plots show a representative sample. Summary is indicated in the graphs. Data are representative of three independent experiments. Each dot represents an individual sample (n = 8 to 10). (B) Ki67 intracellular staining of different small intestine IEL populations derived from WT and Spp-1−/− mice. Cells were gated as in Figure 1A. Data are representative from two independent experiments. Each dot represents an individual sample (n = 9 to 10). *P<0.05; **P<0.01 (Mann-Whitney U test).

