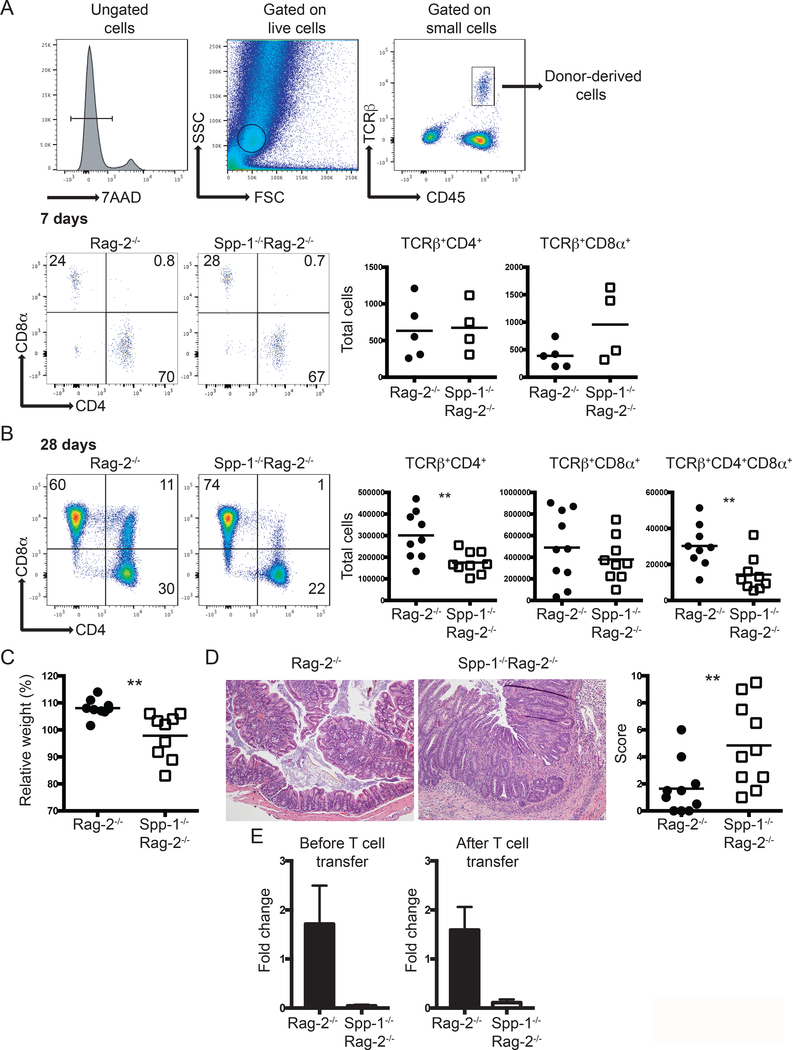
Figure 4.
Environmental osteopontin influences IEL reconstitution and colon inflammation. Enriched total spleen T cells from WT mice were adoptively transferred into Rag-2−/− and Spp-1−/−Rag-2−/− mice. (A) Gating strategy to identify cells derived from donor mice (top). Representative analysis of mice analyzed seven days after transfer (bottom). Dot plots show a representative sample. Results are summarized in the graphs. TCRβ+CD4+CD8α+ cells were not detected above background at this time point in either group. Data are representative from two independent experiments. Each dot represents an individual sample (n = 4 to 5). (B) The same analysis as in (A) performed at 28 days post transfer. Dot plots show a representative sample. Results are summarized in the graphs. Data are representative from three independent experiments. Each dot represents an individual animal (n = 9). (C) Total weight change at 28 days post transfer of mice treated as in (B). (D) Representative H&E stained samples of colon sections from the indicated mice at 28 days (100X magnification). Graph indicates total histological score [immune cell infiltration (3 points), loss of goblet cells (3 points), crypt damage (3 points) and epithelial hyperplasia (3 points)]. For (C) and (D) data are representative from three independent experiments, each dot represents an individual mouse (n = 9). (E) Total mRNA expression from colons of naïve and T cell treated (28 days post-transfer) Rag-2−/− and Spp-1−/−Rag-2−/− mice (n=3–5). **P<0.01 (Mann-Whitney T test).

