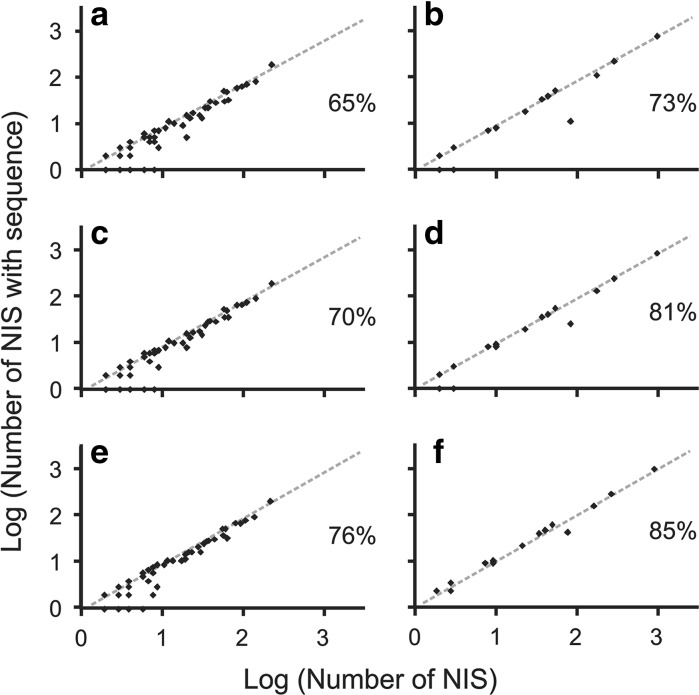
Fig. 4.
Scatter plots with number of NIS per class on x-axis and number of NIS with at least one sequence in at least one genetic database per class on y-axis for aquatic taxa in 2010 (a), terrestrial taxa in 2010 (b), aquatic taxa in 2012 (c), terrestrial taxa in 2012 (d), aquatic taxa in 2016 (e), and terrestrial taxa in 2016 (f). The lines of unity were based on the average percentage of NIS with at least one sequence in at least one genetic database for aquatic taxa in 2010 (a), terrestrial taxa in 2010 (b), aquatic taxa in 2012 (c), terrestrial taxa in 2012 (d), aquatic taxa in 2016 (e), and terrestrial taxa in 2016 (f). Values are log transformed to standardize the data. The average percentages are given for each panel

