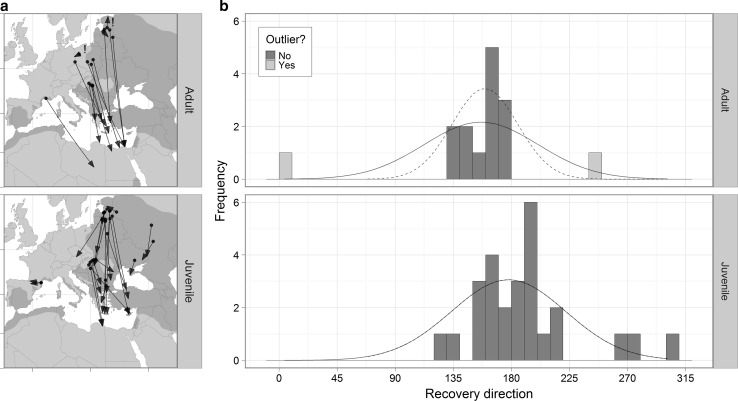
Fig. 2.
Comparison of adult (top) and juvenile (bottom) autumn migration. a Arrows denote direction of movement from ringing to recovery site. b Frequency distribution of autumn recovery direction for adults and juveniles. Curved lines represent the normal density curve with corresponding mean and SD. Outliers were detected using Rosner’s generalized extreme Studentized deviate test (k = 2), and are identified by an exclamation mark in a and light shaded bars and dashed lines in b

