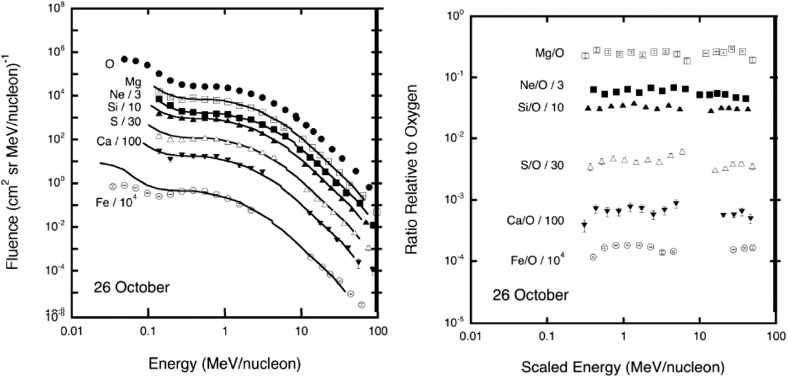
Fig. 20.
Left Event-integrated fluences of O, Ne, Mg, Si, S, Ca, and Fe plotted versus energy during the large SEP event on October 26, 2003. All the spectra except O and Mg have been scaled to better compare the spectral shapes. The solid lines are the oxygen spectra scaled appropriately in energy (see text). Right Abundance ratios relative to oxygen, calculated from the spectra shown on the left, plotted versus scaled energy. Image reproduced with permission from Cohen et al. (2005b), copyright by AGU

