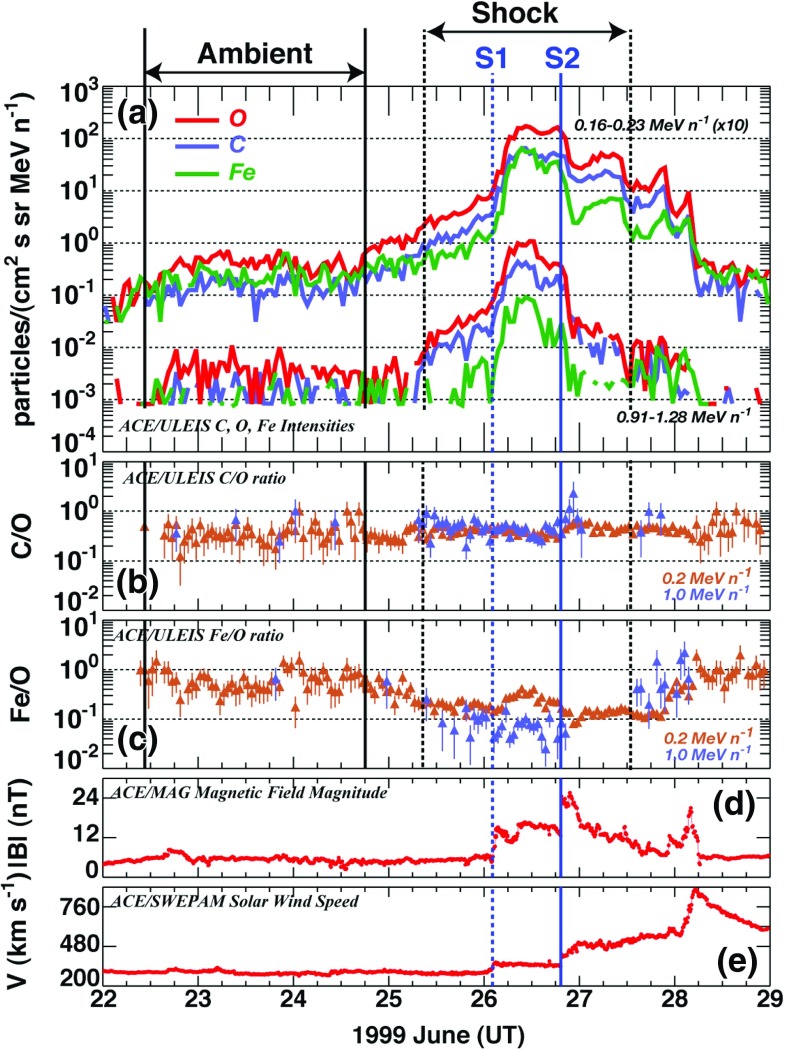
Fig. 29.
Hourly averages of a –0.23 and – C, O, and Fe intensities; b C/O ratios; and c Fe/O ratios from June 22–29, 1999, measured by ACE/ULEIS. The IP shock is identified using 5 min averages of d the magnetic field magnitude B, and e the SW speed V. Blue vertical lines marked S1 and S2 denote the IP shock arrival times at ACE. Dashed black vertical lines represent the time interval for measuring shock-associated energetic ions. Solid black vertical lines represent the time interval for measuring ambient energetic ions in the interplanetary medium. Image reproduced with permission from Desai et al. (2004), copyright by AAS

