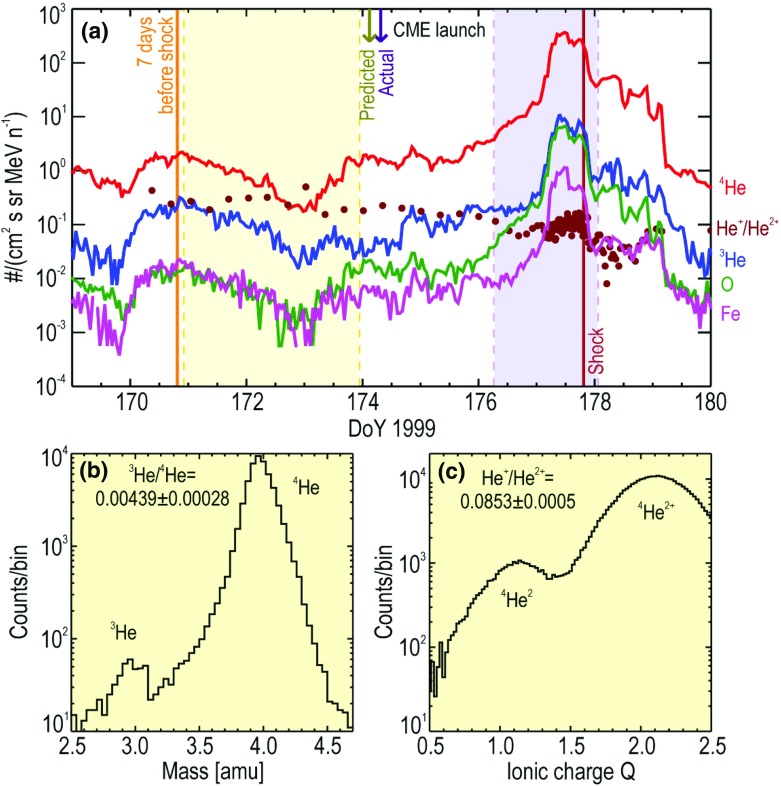
Fig. 35.
a Hourly averaged intensity profiles of 0.25–0.8 MeV/nucleon He, He, O, and Fe (solid lines) measured by ACE/ULEIS and the /He ratio (filled circles) measured by ACE/SEPICA during an IP shock event. The yellow-shaded region identifies the ambient interval, the purple-shaded region shows the time interval for sampling the shock-associated energetic particles, the brown line denotes the shock arrival time at ACE, and arrows at the top indicate the estimated and actual CME lift-off times near the Sun. b He mass histogram from ULEIS, and c He charge state histogram from SEPICA showing well-resolved He and peaks during the ESP event (adapted from Allegrini et al. 2008)

