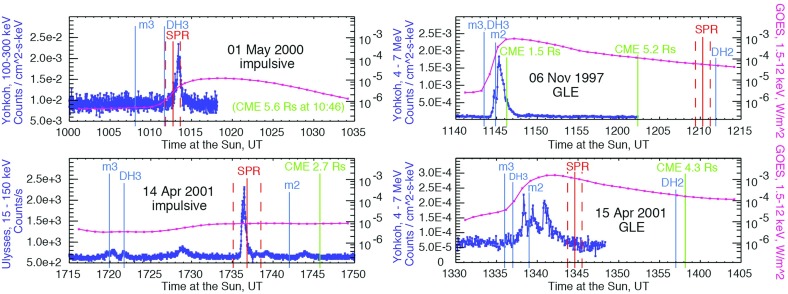
Fig. 41.
Onset times for two impulsive SEP events (left) and two GLEs (right). Blue curves show the intensities of hard X-rays (left panels) and of 4–7 MeV -rays (right panels). The red curves are the GOES 1.5–12 keV soft X-ray intensities. The red vertical lines represent the SPR times inferred from measuring the arrival times of the GLE particles. Also shown are onset times of type II and type III radio bursts and CME lift-off times (after Tylka et al. 2003)

