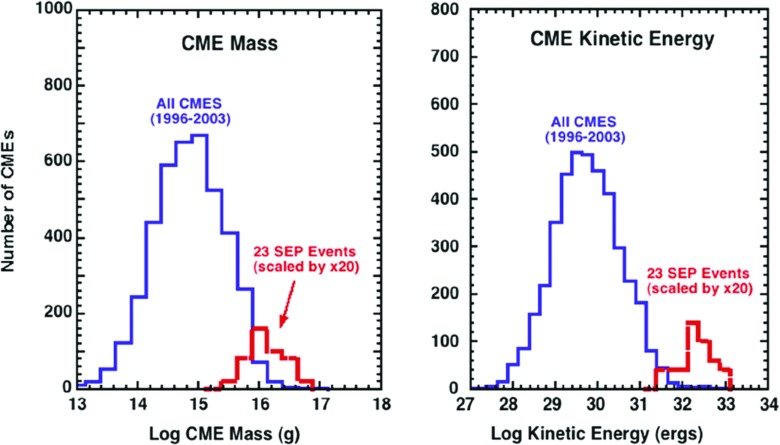
Fig. 9.
Left Comparison of the mass distribution of all CMEs observed from 1996–2003 (Gopalswamy 2006) to the masses of CMEs associated with 23 of the 50 largest SEP events of solar cycle 23 (scaled up by 20). Right Comparison between the distributions of the kinetic energy of CMEs associated with 23 large SEP events from solar cycle 23 and all CMEs observed from 1996–2003. Images reproduced with permission from Mewaldt et al. (2008), copyright by AIP

