
Figure 1.
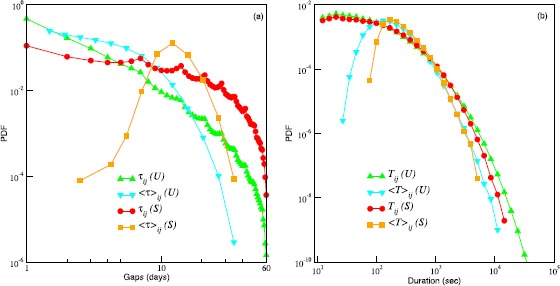
Probability distribution functions (PDFs) for gaps and call durations. (a) PDFs for inter-call times (gaps), and PDFs for the average gaps, ( - calculated with respect to individual pairs ij). The pairs (ijs) are chosen irrespective of the age and gender of the individuals in the pair. The green up-triangles and blue down-triangles correspond to (set of all frequent contacts). The red circles and the orange squares correspond to (set of regular contacts). (b) PDFs for call durations, and for the average call durations, (). The different symbols are used in the same sense as in (a).