
Figure 4.
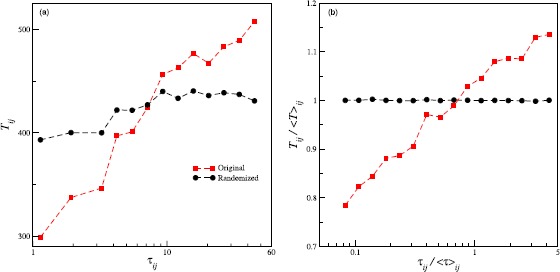
Results of randomization and scaling. (a) The red squares denote the duration of the succeeding call () as a function of the gap () for female-female pairs chosen from (set of regular contacts) with egos in the age cohort 35. The black circles correspond to the data obtained from different realizations when the gaps for each pair are randomly shuffled. (b) The curves result from rescaling the data used in (a). For each pair ij, the gaps are scaled by the average gap for the pair. Similar scaling is used for the durations.