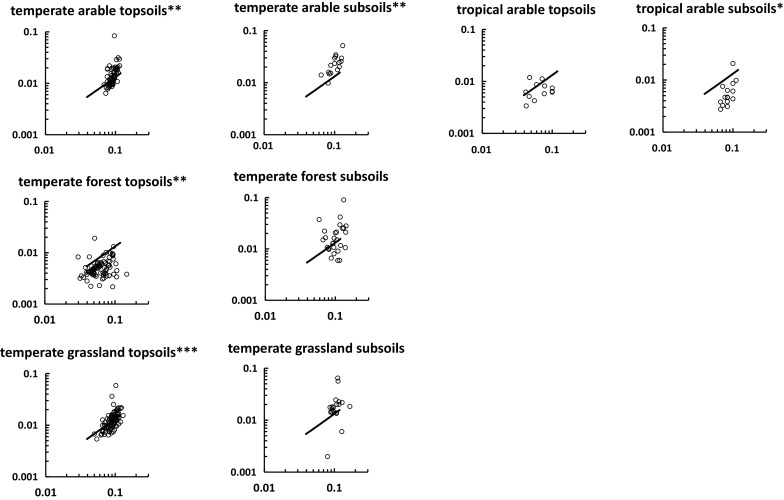
Fig. 6.

Relationships between S:C (y-axis) and N:C (x-axis) for soils from different ecosystems. The significance indicators refer to power-law regressions; *p < 0.05, **p < 0.01, ***p < 0.001. The solid line shows the mixing model trend. Axis labels are omitted for clarity
