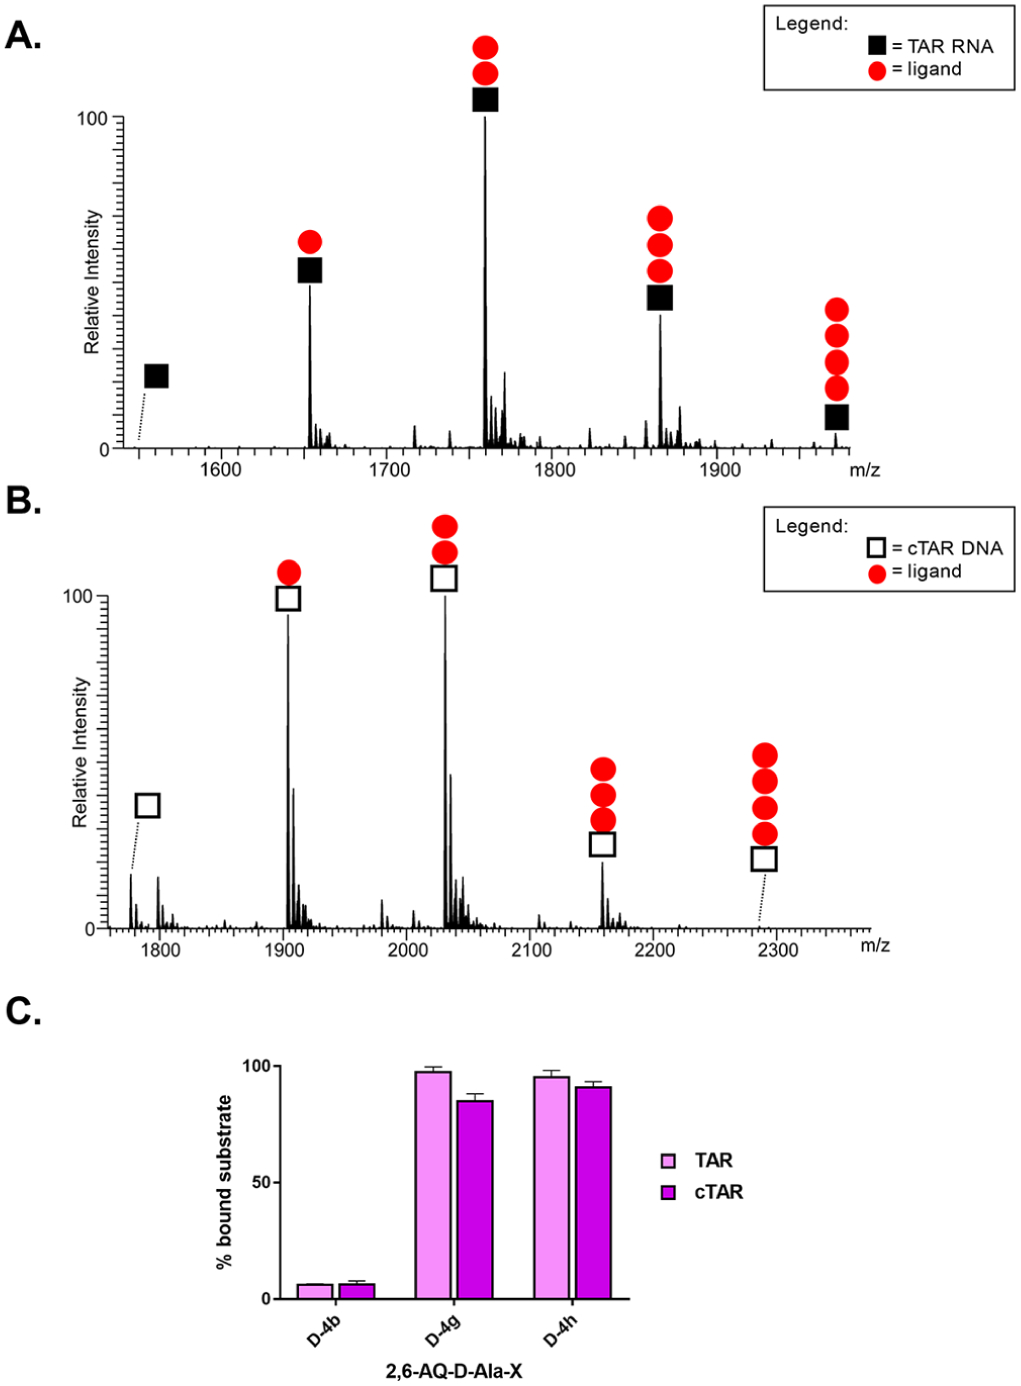
Figure 4.

Representative ESI-MS spectra of samples containing a 1:10 molar ratio of either TAR (A) or cTAR (B) and D-4h (red ●) compound in 150 mM ammonium acetate (see Experimental Section). Symbol ◼ corresponds to TAR RNA substrate and ◻ to cTAR DNA substrate. The stoichiometries of the observed complexes are indicated in each spectrum. Signals of lower intensity detected near free/bound species consist of typical sodium and ammonium adducts. (C) Histograms displaying the percentages of bound substrate observed in A and B spectra and from Figure S4 for D-4b and D-4h. The indicated percentages of bound substrate provide a measure of the relative affinities of d-analogues for either nucleic acid substrate.
