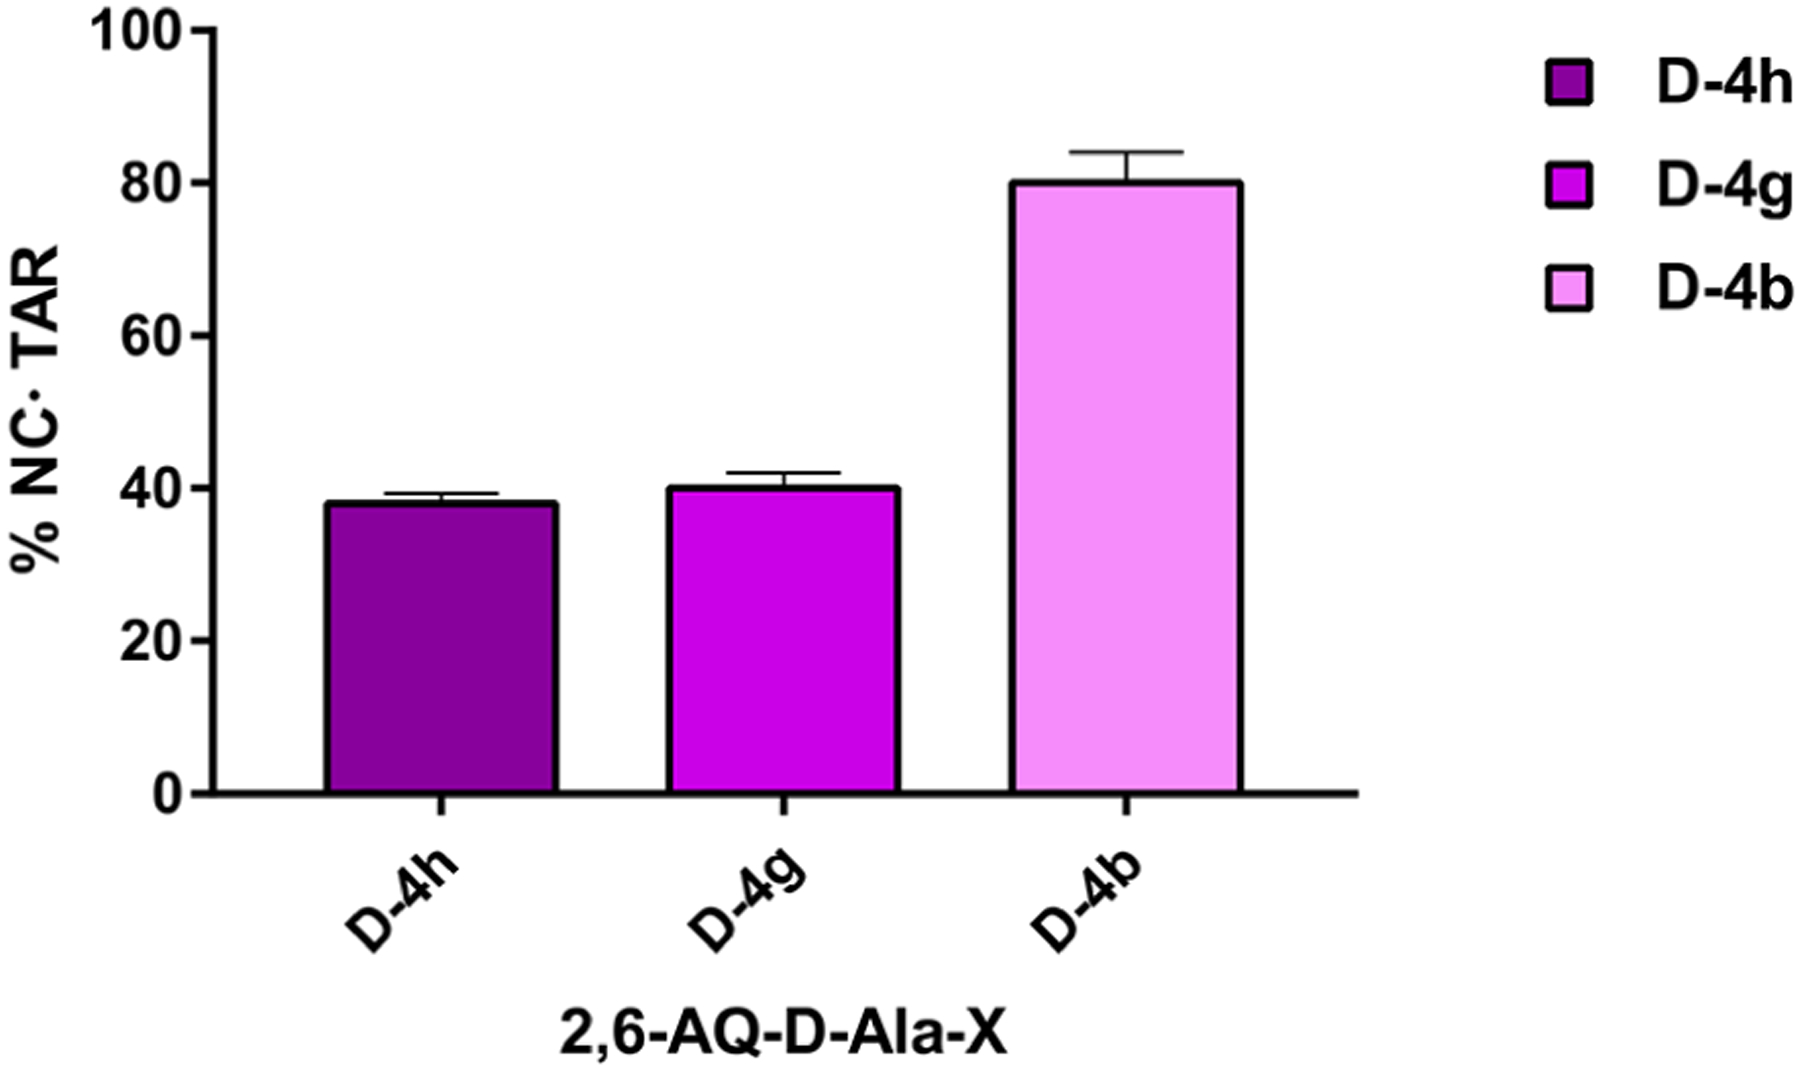
Figure 7.

Representative histogram comparing the percentage of NC protein bound to TAR RNA (NC●TAR complexes) in the presence of ligand D-4h with those of D-4g and D-4b. Data were obtained from ESI-MS analyses of samples prepared following the procedure i, shown in Scheme 3 (see Experimental Section).
