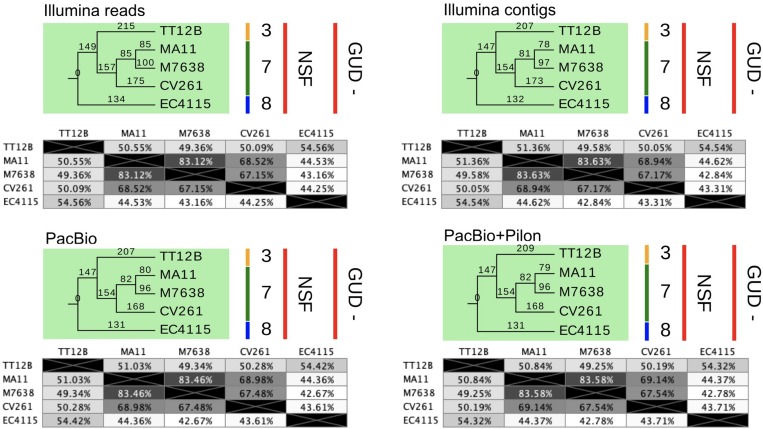
FIGURE 8.
SNP statistics from NGS short- and long-read sequence data. The trees shown are the majority-consensus trees of equally parsimonious trees inferred from all four NGS sequence data sets. Trees were recovered using a heuristic search in PAUP (Wilgenbusch and Swofford, 2003) with 500 bootstrap replicates and each of the computed trees features an overall CI value > = 0.997. The numbers in the pair-wise distance matrices represent percent identity of bases, which are identical. The trees were visualized in Geneious (Kearse et al., 2012) and decorated with strain-associated metadata in EvolView (Zhang et al., 2012; He et al., 2016), such as clade assignment and metabolic properties. As evident when comparing the tree topologies and statistics, all NGS datasets provide a robust basis for phylogenetic studies and carry the identical phylogenetic information.

