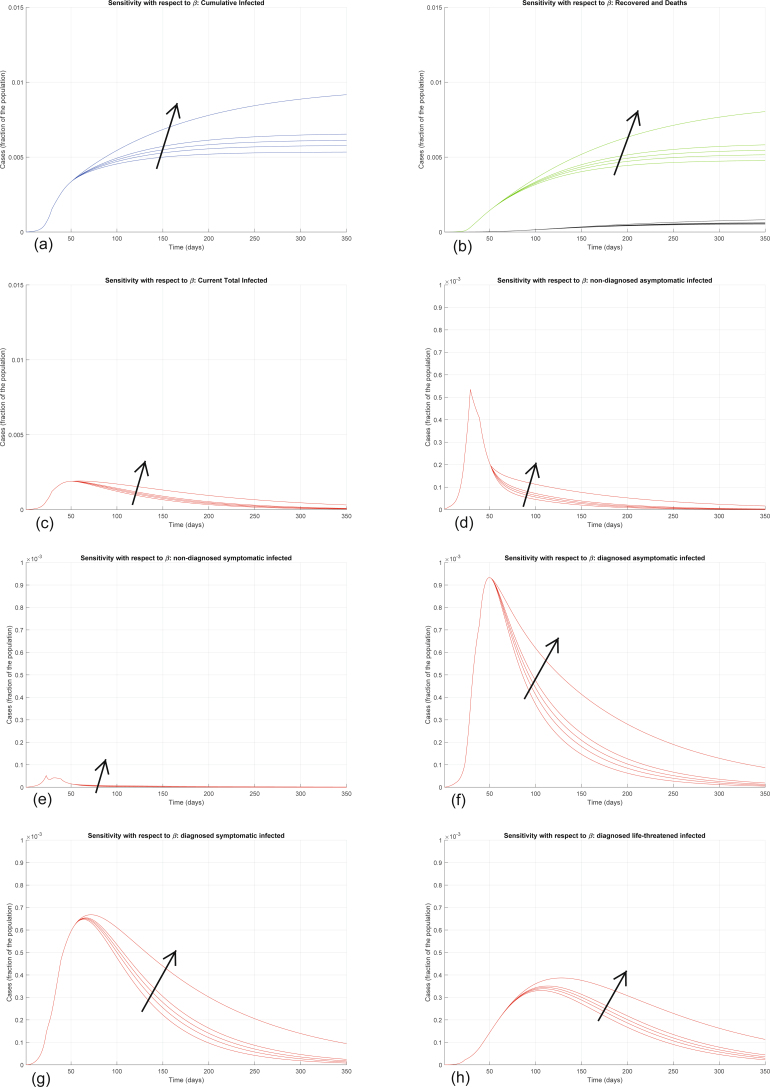
Extended Data Fig. 5. Sensitivity analysis with respect to β.
Sensitivity analysis showing the effect of varying the transmission coefficient β, whose nominal value is β = 0.0050, after day 50. We multiply the nominal value of β by 0.5, 0.8, 1, 1.2, 2, and show the corresponding evolution of the model variables. Panel (a) shows the variation in the total number of cases, panel (b) in the number of recovered individuals (green) and deaths (black), panel (c) in the total number of currently infected individuals, panels (d)–(h) in the number of infected in different categories. Increasing β increases all the curves, although the sensitivity is smaller than with respect to α.

